Advanced features in Test Reporting & Analytics
Experience the full potential of Test Reporting & Analytics by using these advanced features.
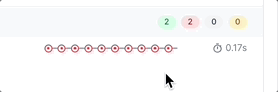
Set quality standards on builds and projects on Test Reporting & Analytics and view alerts if any build breaks them.
Identify issues in your test suites faster with customizable Smart Tags on Test Reporting & Analytics.
Re-run failed tests directly from Test Reporting & Analytics and view all runs of the same test case in one place.
Speed up debugging and root cause analysis with test failures automatically grouped into categories.
Exclude unreliable tests from metrics calculations and keep CI green while waiting for the tests to be fixed.
Focus on the information that matters most to you by setting up custom views in Test Reporting & Analytics.
Improve your test suites with advanced features in Test Reporting & Analytics
With Test Reporting & Analytics, you get many powerful tools to improve the quality of your automation test suites.
The following are a few advanced features you can use in Test Reporting & Analytics:
-
Custom Alerts: You can set up rules on Test Reporting & Analytics on parameters like build stability, flakiness, build performance, and more. Get instantly alerted if a build or project crosses the threshold. Such alerts help you keep a tab on the most important quality metrics of your test suites. You can also set
CriticalandWarninglevels on the same alert to create better workflows to handle quality breaches. Click here to learn how to set up these custom alerts.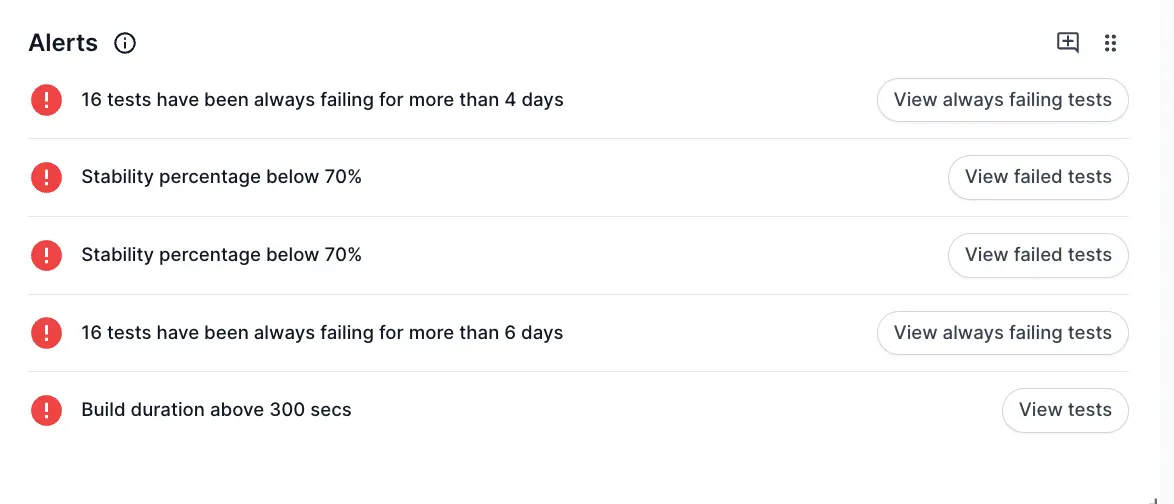
-
Smart Tags: SDETs spend a lot of effort locating and classifying problematic tests in their test suites. Test Reporting & Analytics automatically tags tests as
Flaky,Always Failing,New Failure, andPerformance Anomaly. These Smart Tags help you quickly spot issues in your builds and debug the problematic tests that matter first. You can also configure Smart Tags according to your requirements. Learn more about Smart Tags here.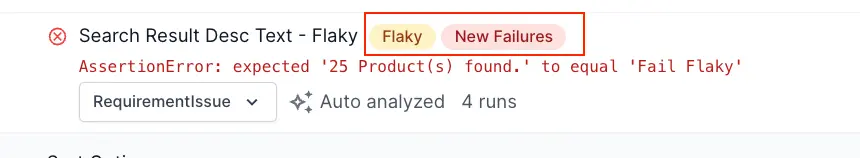
-
Re-run Tests: The ability to re-run tests removes the dependencies on other teams and speeds up the workflow for SDETs. After debugging and fixing a build, SDETs can re-run the build from Test Reporting & Analytics without requesting help from the DevOps team. In Test Reporting & Analytics, you can re-run the tests and automatically map them with previous runs of the same test case.
You can integrate Jenkins and Azure Pipelines with Test Reporting & Analytics to activate the re-run feature. Learn more about re-running tests here.
-
Automatic Failure Analysis: Bugs largely fall into similar patterns of failures. If these patterns are not recognized, SDETs will have to spend too much time debugging issues that were already analyzed. Test Reporting & Analytics automatically categorizes failures in a test suite into various categories like
Product bug,Automation bug,Environment issue, andNo defectusing machine learning algorithms. This classification helps SDETs to focus on the errors that need immediate attention. You can also track which types of errors are plaguing your test suites and take measures to improve them. Learn more about Automatic Failure Analysis here.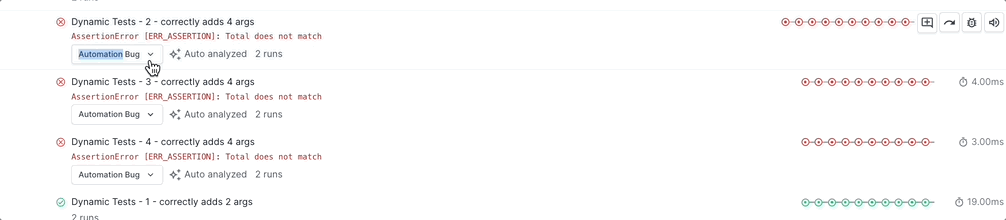
-
Mute Tests: Test suites often have stale test cases that are in the backlog to be fixed. Stale test cases cause builds to fail and skew the metric calculations and insights that Test Reporting & Analytics provides. While you wait for these test cases to be fixed, you can choose to mute them in Test Reporting & Analytics. When you mute a test case, Test Reporting & Analytics excludes them from the overall build run execution results and all metric calculations. Learn how to mute tests here.
-
Custom Views: Views in Test Reporting & Analytics allow you to slice and dice your testing activity based on the criteria that you choose. For example, you could create custom views for different modules of a product. Similarly, you could create views based on factors such as the type of testing, releases, date of test run, test framework, platform used, and many more. Such customized views help you switch between different contexts seamlessly for quicker insights and improved productivity. Learn more about custom views here.
New to Test Reporting & Analytics?
You can integrate Test Reporting & Analytics with your test suite in a few minutes. Test Reporting & Analytics works with most of the leading test frameworks.
Curious to learn more?
Check out the demo sandbox to experience advanced testing using Test Reporting & Analytics.
We're sorry to hear that. Please share your feedback so we can do better
Contact our Support team for immediate help while we work on improving our docs.
We're continuously improving our docs. We'd love to know what you liked
We're sorry to hear that. Please share your feedback so we can do better
Contact our Support team for immediate help while we work on improving our docs.
We're continuously improving our docs. We'd love to know what you liked
Thank you for your valuable feedback!