In test automation, generating detailed and visually appealing reports is crucial for analyzing test results effectively. Allure Report is a powerful reporting framework that provides interactive, easy-to-read test reports with detailed insights, including execution history, failure analysis, and attachments like screenshots and logs.
With Allure, teams can enhance test visibility, improve debugging, and integrate seamlessly with popular automation test frameworks like JUnit, TestNG, and Pytest. This guide explores Allure’s key features and how to integrate it into your automation framework to generate advanced test reports effortlessly.
Overview
- Allure Report is an Open Source Test Reporting framework offering interactive test execution reporting solution.
- It offers visually rich test reports and detailed test insights.
- Works seamlessly with Popular Test Automation Frameworks.
- BrowserStack Test Observability is the key alternative to Allure Reporting as it offers a comprehensive, real-time test reporting and debugging solution that enhances automation efficiency
What is Allure Reporting?
Allure Report is an open-source test reporting framework that generates detailed, visually rich, and interactive test execution reports. It provides a structured way to present test results, making it easier to analyze test trends, failures, and execution history.
Allure Reporting helps teams improve test transparency, simplify debugging, and enhance collaboration through clear and insightful test reports.
Allure integrates seamlessly with popular test automation frameworks like JUnit, TestNG, Pytest, and Cucumber, capturing essential test details such as:
- Test execution status (Passed, Failed, Skipped)
- Step-by-step execution flow
- Screenshots, logs, and attachments for debugging
- Execution history and trends
Why Use Allure for Test Reporting?
Allure Report enhances test reporting by providing clear, interactive, and data-rich insights into test executions. Here’s why it stands out:
- Visually Rich Reports: Generates easy-to-understand, interactive reports with graphs, timelines, and stepwise execution details.
- Detailed Test Insights: Captures test steps, execution history, logs, and screenshots to aid debugging.
- Seamless Integration: Works with popular test frameworks like JUnit, TestNG, Pytest, and Cucumber without complex setup.
- Execution History & Trend Analysis: Helps track test trends over multiple runs to monitor stability and failures.
- Enhanced Collaboration: Enables teams to share detailed reports, improving communication and issue resolution.
Key Features of Allure Reporting
Allure Reporting offers several key features that make it a valuable tool for automated testing:
- Detailed Test Analysis: Allure provides a comprehensive analysis of test execution, including test steps, start time, duration, and status. This level of detail helps identify issues or areas for improvement during each test.
- Visual Appeal: Allure reports present test data in a visually appealing and intuitive manner, using pie charts, graphs, and timelines to make it easier to understand test results at a glance.
- Historical Trend Analysis: Allure stores historical data, enabling teams to track progress and trends over time. This feature helps identify patterns and predict future test performance.
- Facilitates Debugging: Allure’s detailed error reporting includes stack traces, screenshots, and video recordings of failed tests, which are invaluable for troubleshooting.
- Seamless Integration: Allure integrates with a wide range of testing frameworks and Continuous Integration (CI) tools like Jenkins, Bamboo, and TeamCity, facilitating continuous testing and delivery.
- Customization and Extensibility: Allure allows customization of report appearance and content. It also supports extensions and plugins, enabling users to extend its functionality and integrate with third-party tools seamlessly.
- Collaboration and Test Case Management: Allure reports can be shared and viewed by anyone, facilitating team collaboration. It also links test cases with issues in issue trackers or requirements in test management systems, ensuring all requirements are adequately tested.
Setting up Allure Reporting
Integrating Allure with your test framework requires a few setup steps to ensure seamless test reporting.
Prerequisites for Allure Reporting
To set up Allure Reporting, you need to meet the following prerequisites:
- Java Installation: Ensure that Java version 8 or above is installed on your system. The Java directory should be specified in the JAVA_HOME environment variable.
- Allure Installation: Install the Allure command-line tool. This can be done using Scoop on Windows, Homebrew on macOS and Linux, or by downloading and unpacking the Allure archive.
- Environment Variable Setup: Add the path to the Allure bin directory to your system’s PATH environment variable to ensure the allure command is accessible.
Configuring Allure with Different Testing Frameworks
Allure supports integration with various testing frameworks, including TestNG, JUnit, and Pytest. Here’s a brief overview of how to configure Allure with these frameworks:
1. JUnit (Maven Project)
- Add Allure dependencies to pom.xml:
<dependency>

    <groupId>io.qameta.allure</groupId>

    <artifactId>allure-junit5</artifactId>

    <version>2.x.x</version>

</dependency>
- Use Allure annotations like @AllureFeature, @AllureStory for better reporting.
2. TestNG (Maven Project)
- Add Allure TestNG dependency in pom.xml:
<dependency>

    <groupId>io.qameta.allure</groupId>

    <artifactId>allure-testng</artifactId>

    <version>2.x.x</version>

</dependency>
- Add listeners in testng.xml:
<listeners>

    <listener class-name="io.qameta.allure.testng.AllureTestNg"/>

</listeners>
3. Pytest (Python Project)
- Install Allure Pytest plugin:
pip install allure-pytest
- Run tests with Allure:
pytest --alluredir=allure-results
Generating Allure Reports
Generating Allure reports involves a straightforward process that can be automated as part of your testing workflow. Here’s a step-by-step guide on how to generate Allure reports:
Step 1. Run Your Tests
First, run your automated tests using your preferred testing framework (such as, TestNG, JUnit, Pytest). Ensure that the Allure adapter for your framework is enabled and configured to save test results in the Allure format.
Step 2. Save Test Results
The Allure adapter will save the test results in a directory, typically named allure-results. This directory contains files that describe the execution of tests, including test result files and container files for test fixtures.
Step 3. Generate the Report
Use the Allure command-line tool to generate the HTML report from the saved test results. You can use one of two commands:
- allure generate: This command processes the test results and saves an HTML report into a specified directory. It is useful if you need to save the report for future reference or sharing.
allure generate --clean -o allure-report allure-results
- allure serve: This command creates the same report as allure generate but puts it into a temporary directory and starts a local webserver to display the report. It automatically opens the report in your default web browser.
allure serve allure-results
Allure Report Structure: Key Components with Example
Allure reports are structured to provide detailed insights into test executions. Below are the key components of an Allure report along with an example:
1. Overview Dashboard
Displays test execution summary, including total tests, passed, failed, and skipped counts. Provides graphical trends to monitor test stability.
2. Test Cases Section
Lists all executed tests along with statuses (Passed, Failed, Skipped). Each test case includes detailed execution steps, logs, and attachments.
3. Categories (Defect Classification)
Groups test failures into categories like Product Defects, Test Defects, Flaky Tests for easy debugging.
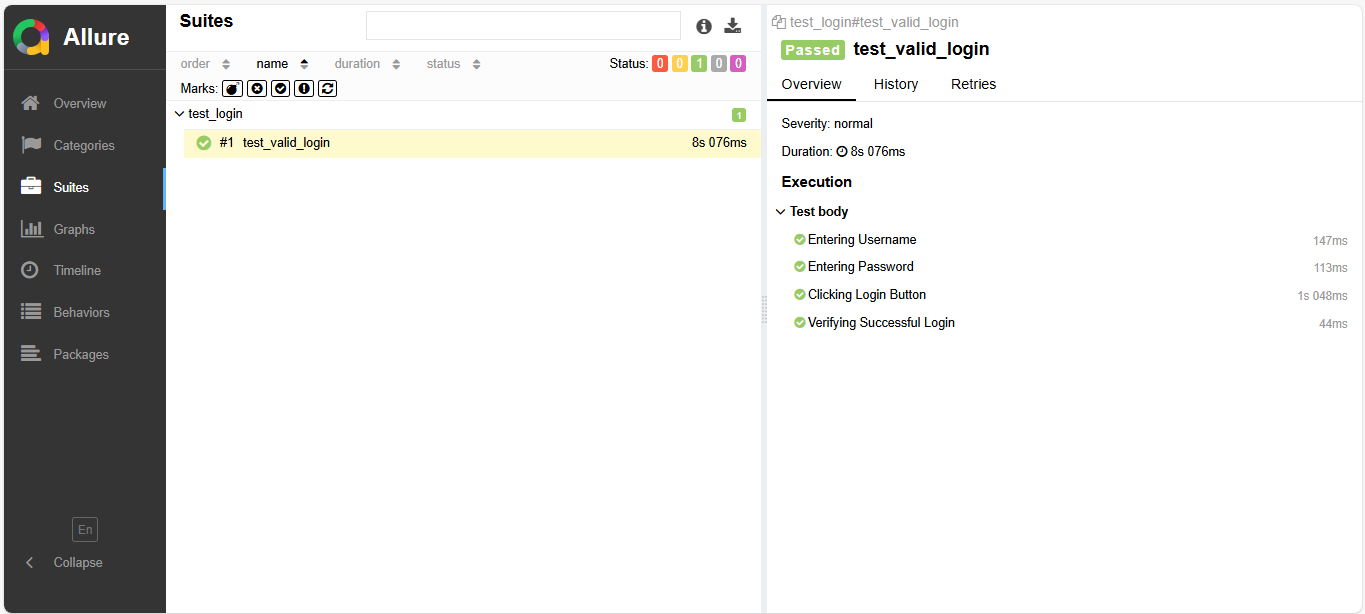
4. Suites Section
Organizes test execution results based on test class or module, helping teams analyze specific test groups.
5. Graphs and Trends
Displays test history, duration trends, and failure rates over multiple executions for better tracking.
Example Output in Allure Report
A sample test execution flow in Allure:
import logging

import time

from selenium import webdriver

from selenium.webdriver import Keys

from selenium.webdriver.common.by import By

import allure


logging.basicConfig(level=logging.INFO)


@allure.feature("Login Functionality")

@allure.story("Valid Login")

def test_valid_login():

   logging.info("Initializing WebDriver")

   driver = webdriver.Chrome()


   logging.info("Navigating to login page")

   driver.get('https://bstackdemo.com/signin')


   with allure.step("Entering Username"):

       username = driver.find_element(By.CSS_SELECTOR, '#react-select-2-input')

       username.send_keys('demouser' + Keys.ENTER)


   with allure.step("Entering Password"):

       password = driver.find_element(By.CSS_SELECTOR, '#react-select-3-input')

       password.send_keys('testingisfun99' + Keys.ENTER)


   with allure.step("Clicking Login Button"):

       driver.find_element(By.CSS_SELECTOR, '#login-btn').click()

       time.sleep(1)


   with allure.step("Verifying Successful Login"):

       loggedIn = driver.find_element(By.CSS_SELECTOR, '.username')

       assert loggedIn.is_displayed()


   logging.info("Test completed successfully")

   driver.quit()
How This Appears in Allure Report
- Feature: Login Functionality
- Story: Valid Login
- Steps: Enter Username > Enter Password > Click Login > Verify Login
This structured report provides a clear execution flow, categorized test results, and debugging insights, making test analysis more efficient.
Analyzing Test Results with Allure
Allure provides detailed insights into test executions, making it easier to analyze results and debug failures. Below are key ways to analyze test reports effectively:
1. Understanding Test Statuses
- Passed – The test executed successfully.
- Failed – The test encountered an assertion failure or error.
- Skipped – The test was skipped due to dependencies or conditions.
2. Stepwise Execution Flow
- Allure captures each test step (such as login, form submission) using @allure.step, making it easy to track failures.
3. Logs and Screenshots for Debugging
- Allure automatically attaches logs and screenshots (if configured) when a test fails.
- Use logging to record detailed execution information for better debugging.
4. Failure Categorization
- Defect Categories: Helps group failures into Product Defects, Test Defects, and Flaky Tests for better tracking.
5. Execution Trends and Performance Analysis
- Allure tracks test history, allowing teams to monitor trends, stability, and performance over multiple runs.
Best Practices for Allure Reporting
To maximize the benefits of Allure Reporting, follow these best practices:
1. Use Step Annotations for Clear Test Execution Flow
Utilize @allure.step to document test actions, making debugging easier.
2. Attach Logs, Screenshots, and Test Data for Better Debugging
Capture and attach logs using Python’s logging module. Save screenshots when tests fail.
3. Categorize Failures for Efficient Defect Management
Define categories in allure.properties to classify failures (like Product Defects, Flaky Tests).
4. Generate and Store Reports for Trend Analysis
Save reports in a centralized location to track test execution trends over time.
5. Integrate Allure with CI/CD for Automated Reporting
Use allure serve in pipelines to generate real-time reports. Configure reports to be accessible via CI/CD dashboards.
Alternative to Allure Reporting: Test Observability
While Allure is a powerful test reporting tool, other solutions focus on test observability, offering deeper insights into automation failures and trends.
BrowserStack Test Observability is a key Allure Reporting Alternative that provides real-time test execution logs, screenshots, and video recordings. It supports parallel execution and automated debugging across multiple devices and browsers.
BrowserStack Test Observability Integrates with CI/CD pipelines for seamless test observability. It enhances test insights, historical trends, and debugging efficiency, helping teams choose the best fit based on their testing needs.
Why Use BrowserStack Test Observability for Test Reporting and Analysis?
BrowserStack Test Observability provides a comprehensive, real-time test reporting and debugging solution that enhances automation efficiency. Teams gain deeper visibility into test executions, making debugging faster and improving overall test quality.
Here’s why it stands out:
- Real-Time Test Insights: Provides logs, screenshots, and video recordings for every test execution.
- Intelligent Failure Analysis: AI-driven categorization of flaky tests, infrastructure issues, and actual failures.
- Centralized Reporting Dashboard: Aggregates test data across multiple browsers, devices, and platforms.
- Seamless CI/CD Integration: Supports Jenkins, GitHub Actions, CircleCI, and Azure DevOps.
- Performance and Trend Analysis: Tracks historical test runs to identify execution patterns and bottlenecks.
Conclusion
Allure Reporting provides a structured and interactive way to generate detailed test reports, helping teams analyze failures efficiently. By integrating Allure with popular testing frameworks, teams can enhance visibility into test execution and debugging.
While Allure is a great reporting tool, BrowserStack’s Test Observability solution offers real-time insights, AI-powered failure analysis, and seamless CI/CD integration for a more advanced testing workflow. Choosing the right reporting tool depends on your project needs, but ensuring clear, actionable insights is key to improving test efficiency and software quality.


