Whether you’re a developer fixing frontend bugs or a tester validating UI behavior, learning how to open console in Chrome helps streamline your workflow.
Overview
You can open the console in Chrome using any of these methods:
- Keyboard Shortcuts: Press Ctrl + Shift + J (Windows/Linux) or Cmd + Option + J (macOS).
- Menu Navigation: Click ⋮ → More Tools → Developer Tools → Console tab.
- Inspect Element: Right-click any page element → Inspect → Switch to Console tab.
- Auto-Open on Launch: Launch Chrome with the –auto-open-devtools-for-tabs flag.
- On Mobile Devices: Connect Android to desktop → open chrome://inspect → Inspect tab.
- On Real Device Cloud: Start a session in BrowserStack Live → Open DevTools → Console.
This article provides a complete guide to each method, with step-by-step instructions for accessing the Chrome console on desktop, mobile, and real device cloud environments.
What Is Chrome Developer Console?
The Chrome Developer Console is a built-in tool for viewing and interacting with a webpage’s front end. It provides real-time access to JavaScript errors, DOM structure, CSS modifications, and browser logs.
Used primarily by developers and testers, the console is part of Chrome DevTools and plays a key role in diagnosing issues during website development and cross-browser testing.
Must Read: How to Inspect Element in Chrome
Importance of Chrome Developer Console
Understanding how to open the console in Chrome is essential for several reasons:
- Helps developers debug JavaScript, inspect variables, and trace runtime errors.
- Testers can validate DOM elements, CSS changes, and real-time browser behavior.
- Facilitates live editing of page content without modifying source code.
- Enables testing of custom scripts, API calls, and selector logic.
The console acts as a live sandbox for any web page, making it critical for functional, performance, and UI testing.
Also Read: Exception Handling in JavaScript
Methods to Open Console in Google Chrome
There are multiple ways to open the console depending on your device, operating system, or testing environment.
Methods to Open Console in Google Chrome:
- Using keyboard shortcuts (Windows, macOS, Linux)
- Via Chrome menu navigation
- Through element inspection
- Automatically on page load
- On Android or real mobile devices
- In BrowserStack Live for cloud-based real device debugging
Below is a description of the main approaches to open console in Google Chrome:
How to Open Console in Chrome Using Keyboard Shortcuts
This is the fastest method and is widely used by developers for instant access.
For Windows/Linux:
- Press Ctrl + Shift + J to open the Console tab directly.
- Alternatively, press Ctrl + Shift + I and click on the Console tab.
For macOS:
- Press Cmd + Option + J for direct console access.
- Or use Cmd + Option + I to open DevTools, then switch to Console.
These shortcuts work regardless of the page context and are ideal for fast debugging.
Also Read: How to Perform Mobile Browser Debugging
How to Open Console in Chrome Using Menu Navigation
This method is helpful for users unfamiliar with keyboard shortcuts.
Step-by-step:
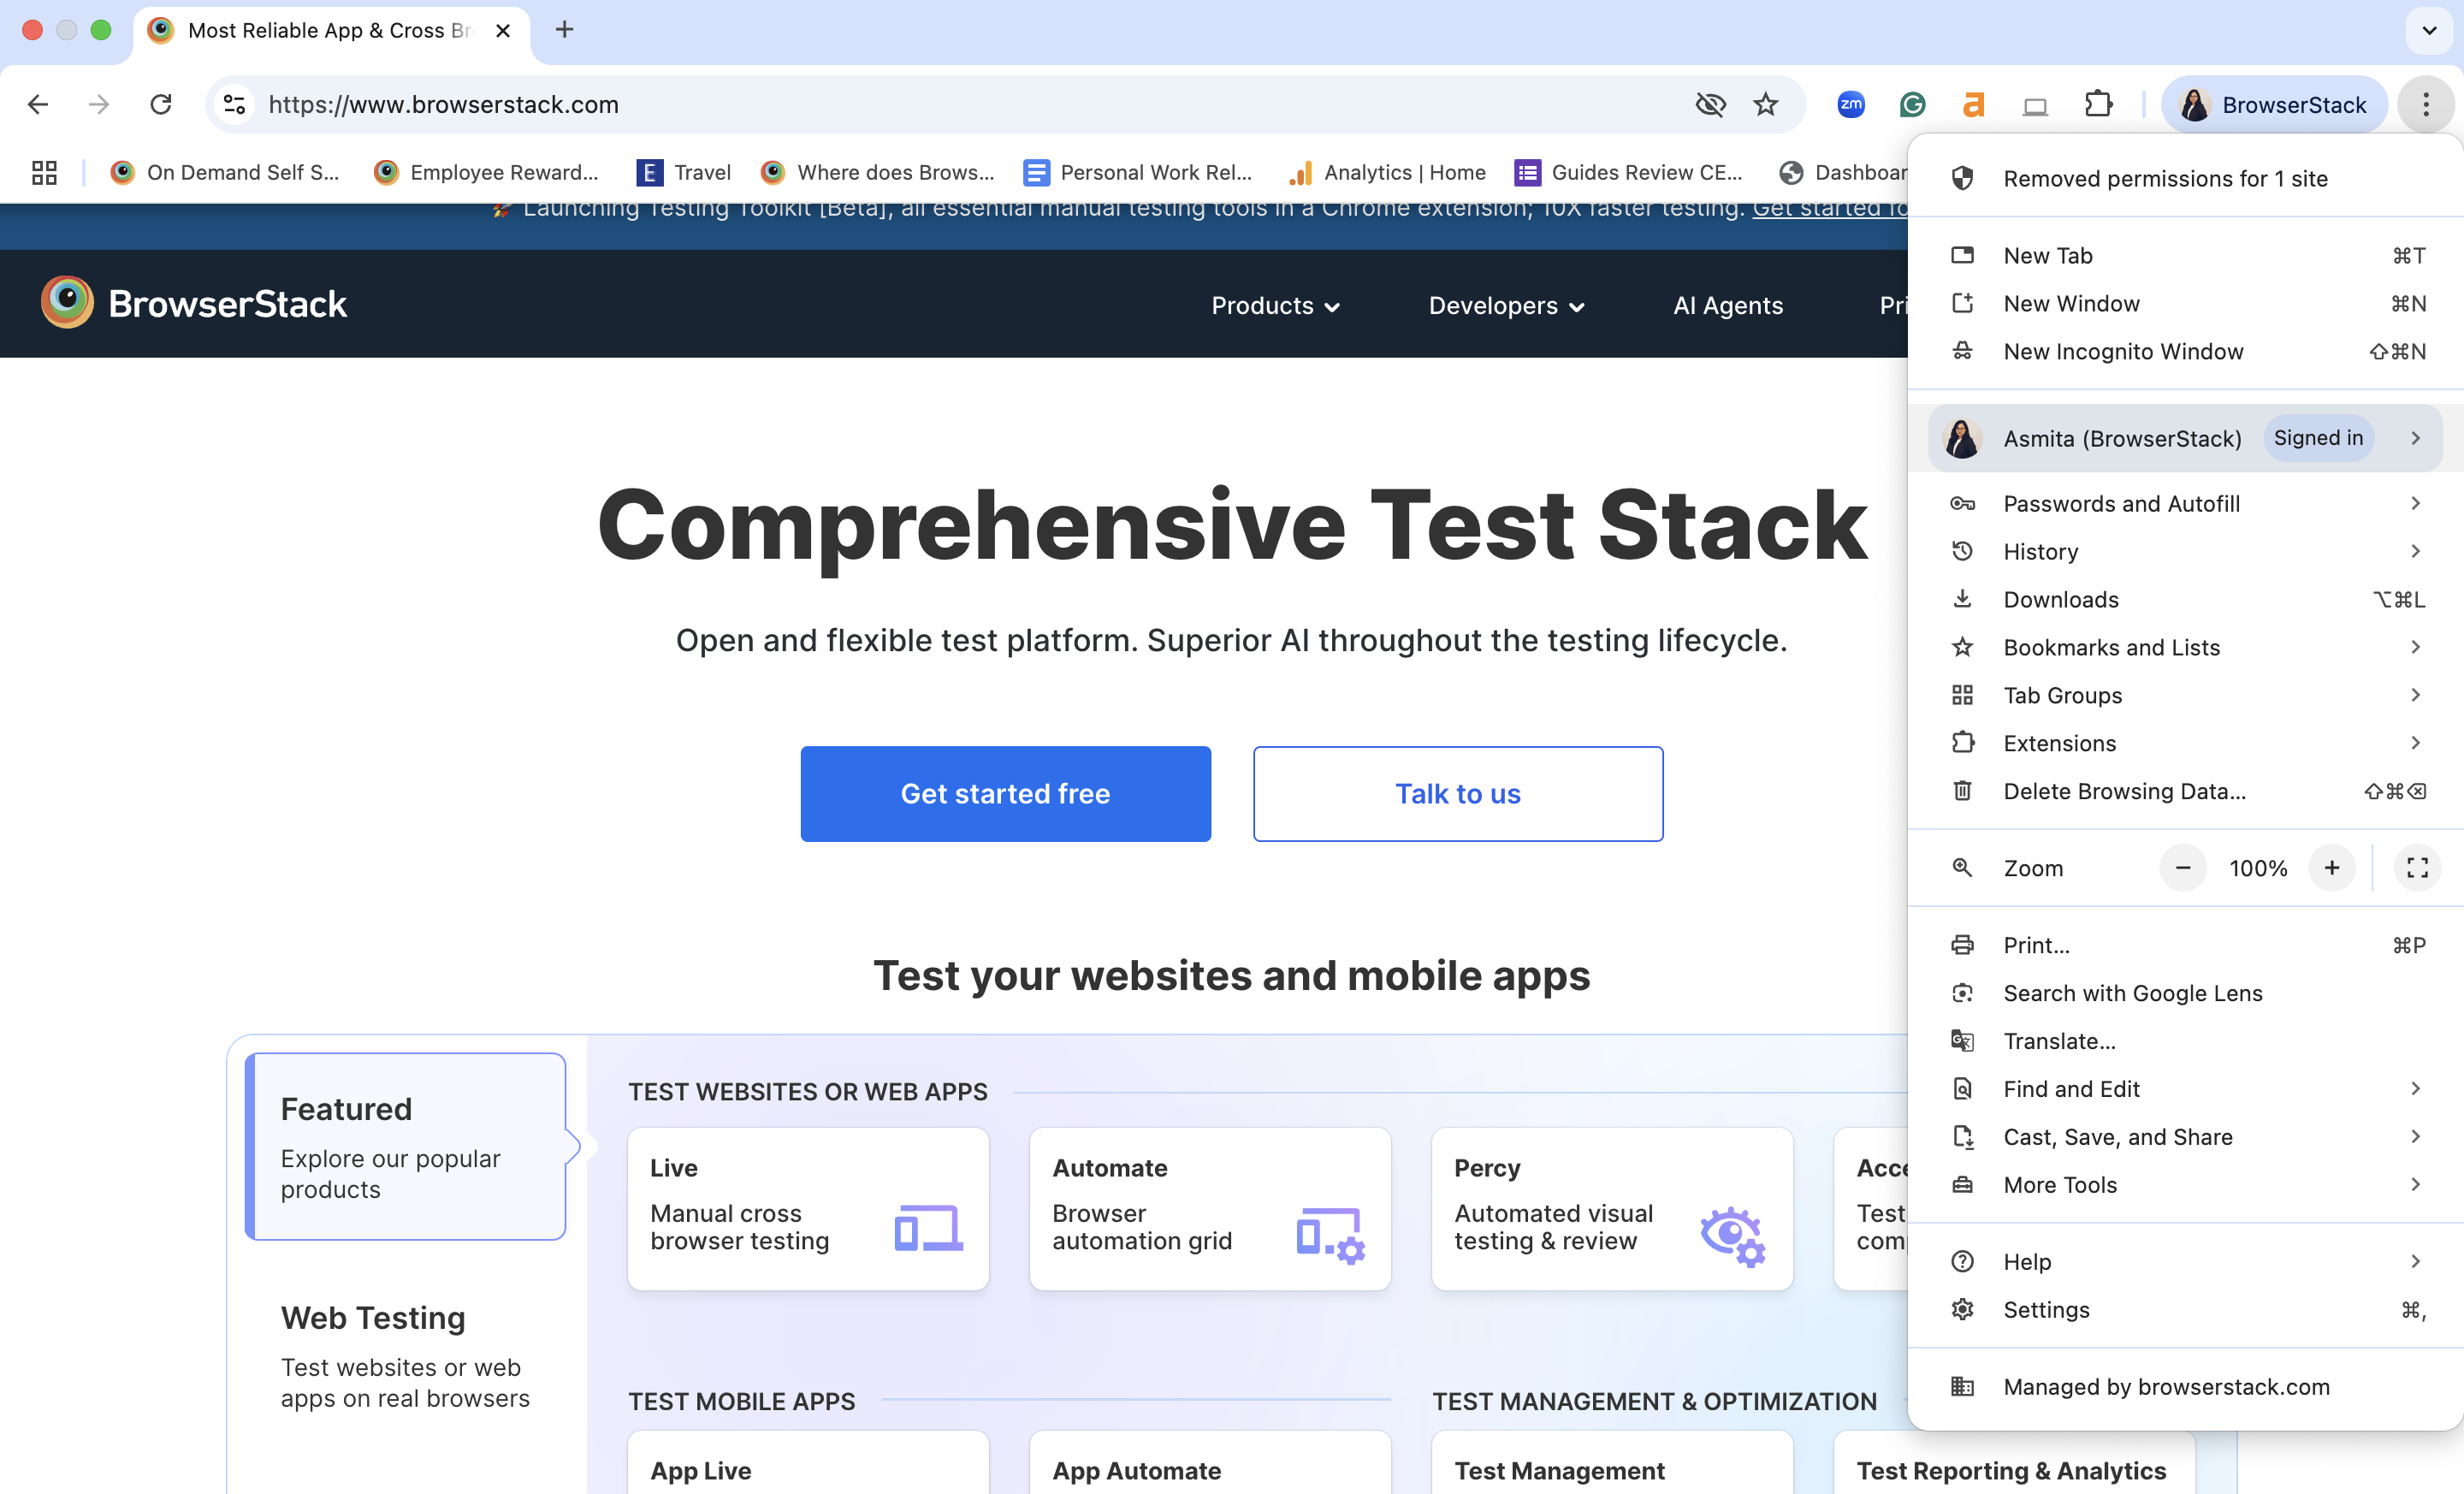
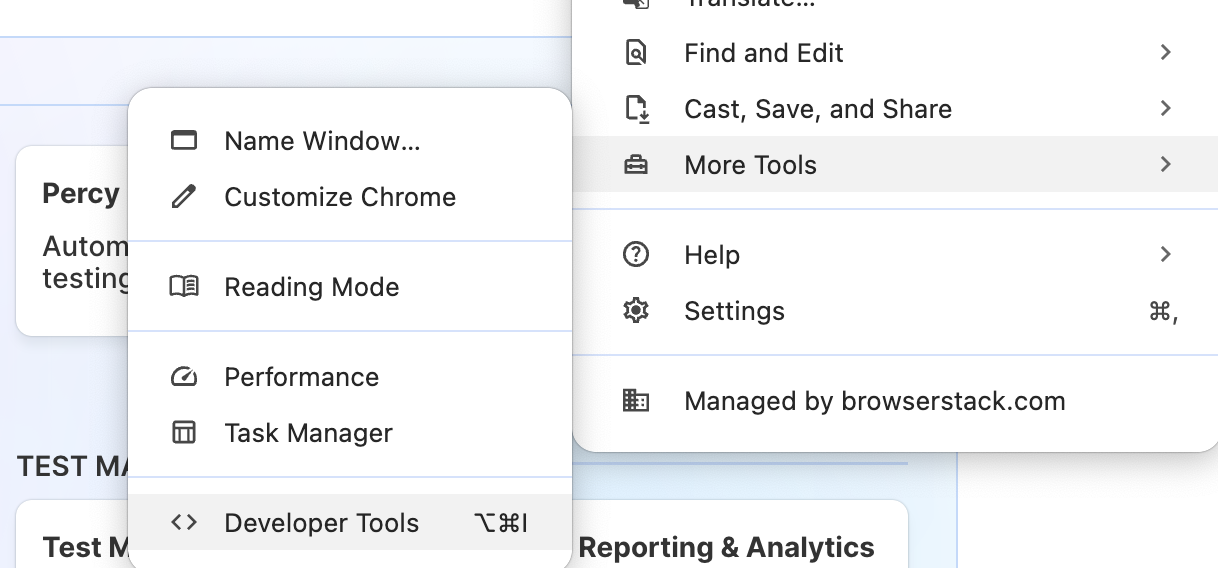
1. Click the three-dot menu (⋮) in the top-right corner of Chrome.
2. Go to More tools → Developer tools.
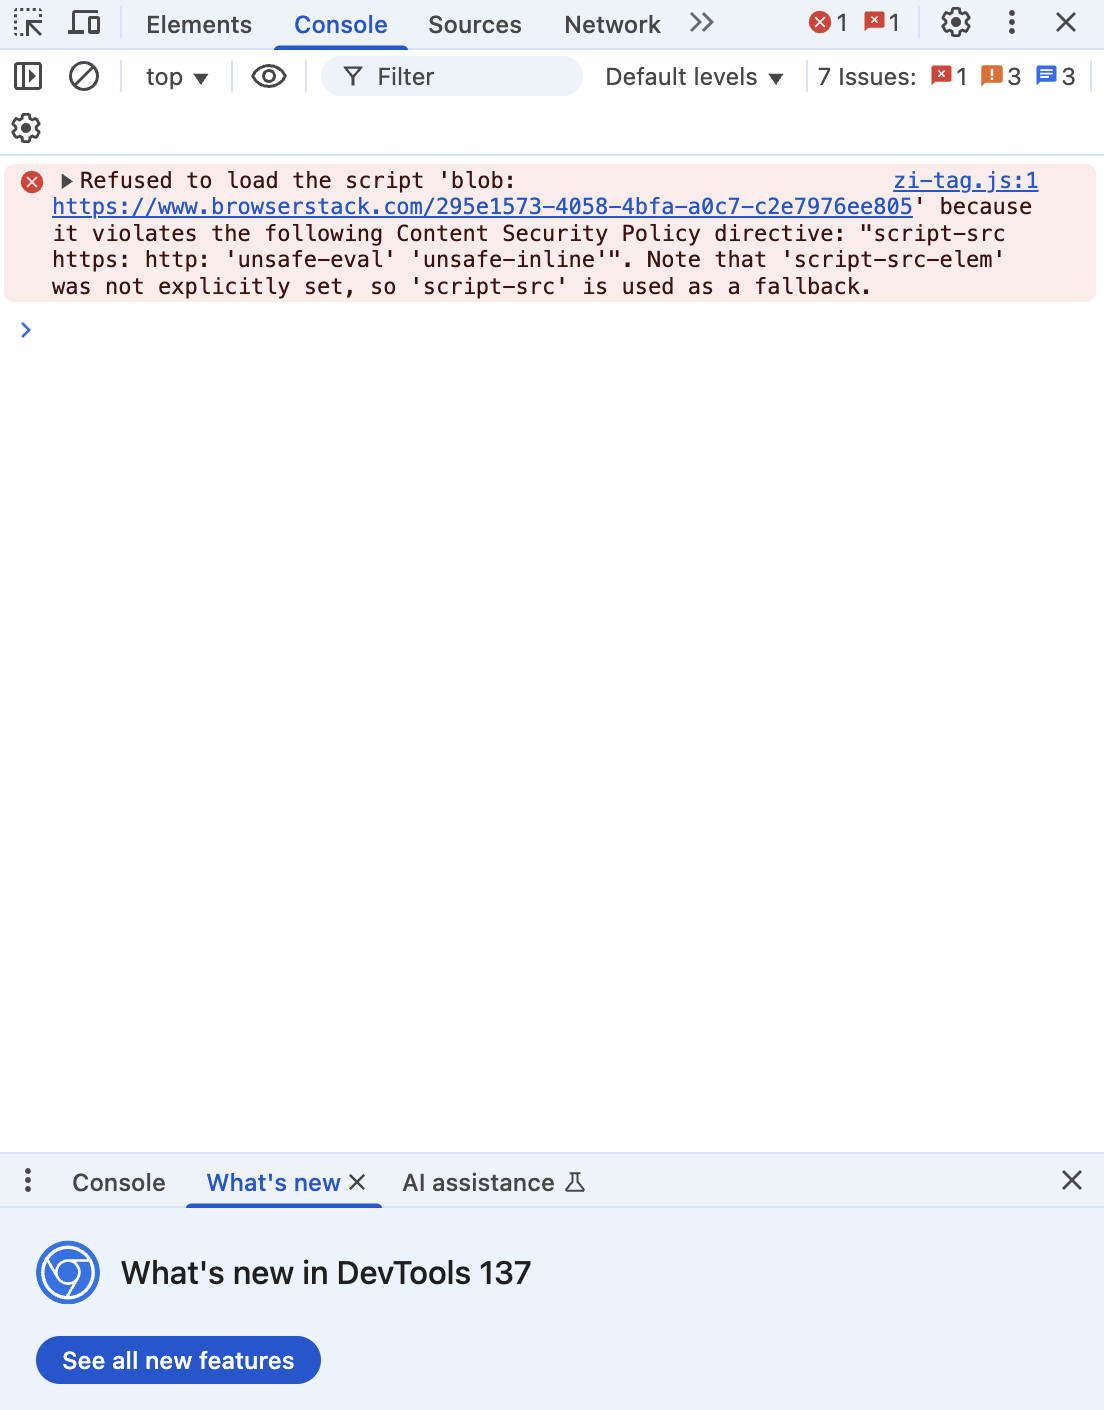
3. Once DevTools opens, switch to the Console tab in the top navigation bar.
This ensures access even on locked keyboards or when shortcuts are unavailable.
How to Open Console in Chrome by Inspecting Elements
Opening the console via element inspection is useful when debugging a specific UI component.
Here’s how:
- Right-click on the element you want to inspect.
- Select Inspect from the context menu.
- Chrome opens DevTools with the Elements tab active.
- Click the Console tab to view logs and execute commands.
This method preserves the element context, making it ideal for DOM-related debugging.
Also Read: How to Inspect Element on Android Device?
How to Open Console in Chrome Automatically on Page Load
If you develop or test a site frequently, you may want Chrome to launch with the console already open.
Method for Local Chrome Launch:
Use the following terminal command:
chrome --auto-open-devtools-for-tabs
This will open DevTools (Console tab active) by default for every new tab.
For Automation (e.g., Selenium or Puppeteer):
You can pass this flag in your test configuration:
{

  "capabilities": {

    "goog:chromeOptions": {

      "args": ["--auto-open-devtools-for-tabs"]

    }

  }

}
This is useful for QA teams running automated visual or functional tests.
How to Open Console in Chrome on Android or Mobile Devices
Chrome’s mobile browser doesn’t support DevTools natively, but you can still access it from your desktop.
To enable remote debugging:
- Enable Developer Options on your Android device.
- Turn on USB debugging.
- Connect your device to your desktop.
- Open chrome://inspect in your desktop Chrome.
- Under “Remote Target,” click Inspect next to the connected tab.
This opens the mobile tab’s console on your desktop, enabling mobile-specific testing.
How to Open Console in Chrome on Real Device Cloud
If you can’t access physical devices, you can use BrowserStack Live to open Chrome console on real desktop and mobile devices.
Steps:
- Go to BrowserStack Live and start a session.
- Choose a real device and Chrome browser version.
- Once the session loads, open DevTools via the Chrome menu or shortcuts.
- Use the Console tab to inspect logs, execute JS, or resolve layout issues.
BrowserStack Live allows testing across thousands of real device-browser combinations without setup, which is ideal for cross-browser debugging with console access.
Common Console Use Cases for Developers and Testers
Developers and QA professionals use the console for tasks like:
1. Viewing and resolving JavaScript errors.
2. Logging custom messages using console.log()
3. Checking network requests and responses.
4. Executing DOM commands like:
document.querySelector('button').click();5. Testing API calls or async functions directly in the browser.
Conclusion
Knowing how to open the Chrome console is a foundational skill for web developers and testers. Whether you’re checking logs during development or debugging a test script, Chrome’s console provides the visibility and control needed to troubleshoot issues efficiently.
For those working in distributed or mobile-first environments, using BrowserStack Live ensures full console access on real browsers and devices.

