Tracking the right metrics is critical to improving software quality. These metrics reveal what’s working, what’s not, and where testing needs to go deeper.
Overview
What Are Software Quality Testing Metrics?
These are quantifiable measures that track different aspects of the testing process. They help assess how much is tested, how many defects exist, how efficiently testing is done, and how it affects product quality.
Why Measure Software Quality in Testing?
Measuring quality in testing helps identify gaps in test coverage, track defect trends, and evaluate team efficiency. For example, knowing the defect leakage rate highlights how many bugs escape to production and where testing needs to improve.
Top Software Quality Testing Metrics
Track these core metrics to monitor quality, improve processes, and align teams:
- Test Coverage Metrics: Indicates how much of the application’s code or requirements are tested, such as code coverage or requirements coverage.
- Defect Management Metrics: Captures the number, severity, and escape rate of bugs, such as defect density, defect leakage, and resolution time.
- Test Effort Metrics: Reflects the time and resources spent across test phases, such as execution time, test design hours, and tester productivity.
- Testing ROI Metrics: Measure the return on testing efforts, such as cost per defect and savings from catching bugs early.
This article explains software quality testing metrics in detail, so you can track test performance, identify gaps, and improve overall product quality with data-backed decisions.
What Are Software Quality Testing Metrics?
Software quality testing metrics are specific, measurable values used to evaluate the effectiveness, efficiency, and coverage of software testing activities. These metrics offer a structured way to monitor testing progress, assess risks, and maintain consistent quality standards across development cycles.
These software metrics also help quantify aspects like the amount of the application being tested, the number of defects found, how quickly they are resolved, and the effort spent during testing.
Why Track Software Quality Metrics?
Tracking software quality metrics helps teams understand the effectiveness of their testing efforts and identify areas for improvement. Without metrics, it’s difficult to know whether the testing process is thorough, efficient, or aligned with business goals.
- Identify Gaps in Coverage: Metrics like code coverage or requirements coverage reveal untested areas of the application. This helps teams add missing test cases and reduce the risk of undetected bugs.
- Monitor Defect Trends: Defect metrics show the number of bugs found, where they are found, and how long it takes to fix them. This helps prioritize high-impact issues and improve response times during development and regression testing.
- Understand Test Effort: Tracking metrics related to execution time or test design helps assess how much time and effort are being spent in each test phase. This supports better planning, resource allocation, and team productivity.
- Evaluate Release Readiness: Quality metrics help determine if the product is stable enough for release by showing defect rates, test coverage, and unresolved issues. This helps reduce the chance of post-release failures.
- Prove the Value of Testing: ROI-focused metrics such as cost per defect or savings from early defect detection provide hard data to justify QA investments to leadership and stakeholders.
Important Software Quality Testing Metrics
These software quality metrics help evaluate code reliability, user experience, delivery speed, and testing ROI. Below is a list of metrics that you must track.
Test Coverage Metrics
Test coverage metrics measure how much of the application has been tested in terms of test execution, features, risks, and requirements. They help track testing progress, confirm that all key areas are covered, and guide what needs to be tested next.
1. Test Execution Progress
This metric tracks the number of planned test cases executed, whether passed, failed, or blocked. Measuring test execution also helps teams monitor daily progress, estimate completion timelines, and adjust priorities based on execution pace.
Here’s how to calculate the test execution progress.
Execution Progress (%) = (Executed Test Cases ÷ Total Planned Test Cases) × 100
For example, if a team has planned 200 test cases and executed 150 so far, the execution progress would be 75%.
Read More: What are Test Execution Tools?
2. Functional Coverage
Functional coverage measures how many of the application’s features or functions are covered by test cases. It ensures that all key functionalities are tested and reduces the chances of missing critical behaviors during validation.
Use this formula to calculate the functional coverage percentage.
Functional Coverage (%) = (Features with Test Coverage ÷ Total Features) × 100
For example, if the product has 50 documented features and tests exist for 45 of them, the functional coverage is 90%.
3. Risk Coverage
This metric reflects how well the testing process covers identified business or technical risks. It ensures high-risk areas are tested first and adequately, supporting risk-based testing strategies.
Calculate risk coverage using this formula.
Risk Coverage (%) = (Tested Risks ÷ Total Identified Risks) × 100
For example, if 20 risks are documented and 16 have corresponding test cases, the risk coverage would be 80%.
Also Read: How to Perform Software Risk Assessment
4. Requirements Coverage
Requirements coverage indicates how many documented requirements are linked to test cases. It improves test traceability and confirms that all requirements are being validated before release.
You can calculate Requirements Coverage using the following formula.
Requirements Coverage (%) = (Requirements with Linked Tests ÷ Total Requirements) × 100
For example, if there are 100 requirements and 92 have linked test cases, the requirements coverage is 92%.
Read More: Importance of Traceability Matrix in Testing
Defect Management Metrics
Defect management metrics help teams understand the volume, spread, timing, and handling of bugs during testing. These metrics provide insights into product stability, testing effectiveness, and how quickly issues are identified and resolved.
5. Defects per Requirement
This metric shows how many defects are associated with each requirement. A high number may indicate unclear requirements or gaps in understanding.
Calculate defects per requirement using this formula.
Defects per Requirement = Total Defects ÷ Number of Requirements
For example, if 120 defects are linked to 60 requirements, the ratio is 2 defects per requirement.
6. Defect Distribution
Defect distribution tracks where defects occur, such as by module, component, or feature. It helps identify problem areas and focus future testing and development efforts.
Note: There is no fixed formula for defect distribution, as it depends on how defects are grouped, typically by module, component, or feature.
For example, if 50 out of 80 defects are found in the payment module, that module accounts for 62.5% of all defects.
7. Defect Detection Rate
This metric reflects how quickly defects are found during a given test phase. It helps assess test effectiveness and stability over time.
Calculate the defect detection rate with this formula.
Defect Detection Rate = Number of Defects Found ÷ Time Period (Days/Weeks)
For example, if 30 defects are found over 5 days, the detection rate = 30 ÷ 5 = 6 defects per day.
8. Defect Leakage
Defect leakage measures the number of bugs that were missed during testing and found later in production or UAT. It highlights blind spots in the test process.
Here’s how to calculate defect leakage.
Defect Leakage (%) = (Defects Found Post-Release ÷ Total Defects) × 100
For example, if 10 out of 100 total defects were found after release, the leakage rate is 10%.
9. Mean Time to Detect (MTTD)
MTTD shows the average time it takes to identify a defect after it’s introduced. Lower values indicate quicker feedback and better test coverage.
Use this formula to calculate the mean time to detect.
MTTD = Total Time to Detect All Defects ÷ Number of Defects
For example, if five bugs were found 3, 4, 5, 6, and 2 days after being introduced, the MTTD is (3+4+5+6+2) ÷ 5 = 4 days.
10. Mean Time to Resolution (MTTR)
MTTR tracks the average time taken to fix a defect after it’s reported. It reflects team responsiveness and overall issue-handling efficiency.
Here’s how to calculate mean time to resolution.
MTTR = Total Time to Resolve All Defects ÷ Number of Defects Resolved
For example, if a set of defects took 2, 3, 4, and 1 days to resolve, the MTTR is (2+3+4+1) ÷ 4 = 2.5 days.
Also Read: Top Defect Management Tools
Test Effort Metrics
Test effort metrics track the time, work, and output spent on different testing phases. These metrics help evaluate team productivity, optimize resource allocation, and improve future test planning.
11. Number of Tests in a Given Time Frame
This metric counts the number of test cases created or executed within a defined period. It helps measure team output and track productivity trends.
Here’s how to calculate the number of tests in a given time frame.
Tests per Day = Total Test Cases ÷ Number of Days
For example, if a team executes 500 tests over 10 days, the average is 50 tests per day.
12. Test Design Efficiency
Test design efficiency compares the number of test cases created to the time taken to design them. It helps evaluate how quickly the team can convert requirements into tests.
You can calculate test design efficiency using this formula.
Test Design Efficiency = Number of Test Cases ÷ Hours Spent on Test Design
For example, if 60 test cases are designed in 15 hours, the efficiency is 4 tests per hour.
13. Number of Bugs per Test
This metric shows how many defects are found in proportion to the number of test cases executed. It reflects the density of defects uncovered through testing and helps evaluate the fault-detection capability of your test suite.
Use this formula to calculate the number of bugs per test.
Bugs per Test = Number of Defects ÷ Number of Executed Test Cases
For example, if 30 bugs are found after running 300 tests, the result is 0.1 bugs per test.
Also Read: Bug vs Defect: Core Differences
14. Average Time to Test a Bug Fix
This tracks the time taken to verify a bug fix once it’s marked ready for testing. It helps identify delays in validation and regression cycles.
Here’s how to calculate the average time to test a bug fix.
Avg Time per Fix = Total Time for Fix Validation ÷ Number of Fixes Tested
For example, if it takes an average of 3 hours to test a bug fix across 10 issues, this is the reference for estimating future fix validations.
Testing ROI Metrics
Testing ROI metrics focus on the cost and business impact of testing activities. They help justify QA investments, evaluate cost-efficiency, and identify areas where untested code or delays may lead to higher risk.
15. Cost per Bug Fix
This metric calculates the average cost of identifying and resolving a defect. It includes labor, tools, and retesting time.
Use this formula to calculate the cost per bug fix.
Cost per Fix = Total Cost to Fix Defects ÷ Number of Defects Fixed
For example, if a team spends $10,000 to fix 50 bugs, the cost per fix is $200.
16. Cost of Not Testing
This estimates the potential business loss from bugs found after release. It includes customer churn, support costs, legal risks, and brand damage.
Here’s how to calculate the cost of not testing.
Cost of Not Testing = Revenue Loss + Support Costs + Damage from Bugs
For example, if a critical bug causes a 2-day outage resulting in $25,000 lost revenue and $5,000 in support costs, the total cost of not testing would be $30,000.
17. Schedule Variance
Schedule variance compares actual testing time to the planned schedule. It helps assess timeline accuracy and project delays.
Use this formula to calculate the schedule variance.
Schedule Variance (%) = ((Actual Time − Planned Time) ÷ Planned Time) × 100
For example, if testing was planned for 10 days but took 12, the variance is (12–10) ÷ 10 × 100 = 20% delay.
Essential Software Quality Metrics
Beyond testing metrics, software quality depends on deeper attributes like reliability, usability, and performance. These core quality metrics help teams evaluate whether the software meets real-world expectations, supports user needs, and maintains high technical standards over time.
1. Code Quality
Code quality reflects how well the code is written in terms of readability, maintainability, and correctness. Clean and consistent code is easier to review, test, and modify. Poor-quality code increases the risk of bugs, slows development, and makes onboarding harder.
There is no universal formula for measuring code quality, but it often includes factors like duplication, code complexity, number of style violations, and clarity of logic.
2. Reliability
Reliability measures how consistently the software performs without failures under normal conditions. Reliable software behaves as expected over time, even when used repeatedly. It is critical for systems where downtime or malfunction can disrupt users or cause losses.
You can measure reliability using:
Reliability (%) = (Total Uptime ÷ Total Time) × 100
For example, if the system is operational for 719 out of 720 hours in a month, reliability = (719 ÷ 720) × 100 = 99.86%
Read More: What is Reliability Software Testing
3. Performance
Performance measures how efficiently the software responds to user actions and handles system load. It includes response time, memory usage, CPU consumption, and throughput under different conditions. Performance issues can lead to delays, timeouts, or crashes, especially in high-traffic environments.
Performance is usually measured using the following indicators:
- Response Time: Time taken to complete a single user action or request.
- Throughput: Number of transactions or requests the system handles in a given time.
- Latency: Delay between initiating a request and the start of the response.
4. Usability
Usability assesses how easy and intuitive it is for users to interact with the application. Good usability means users can complete their tasks quickly and without confusion. It affects user satisfaction, support requests, and adoption rates.
Usability is typically evaluated through metrics such as:
- Task success rate (percentage of users who complete a task correctly)
- Time on task (how long it takes to finish a task)
- Error rate (how often users make mistakes)
These metrics are usually collected during user testing or observational studies.
Also Read: Usability Testing Tools
5. Cycle Time
Cycle time tracks how long it takes for a piece of work to move from development to production. It includes coding, testing, code review, and deployment. A shorter cycle time reflects better team coordination and fewer blockers in the development process.
Here’s how to calculate the cycle time.
Cycle Time = End Date – Start Date
For example, if a feature starts on June 1 and is released on June 5, the cycle time is 4 days.
Read More: How to reduce Testing Cycle Time?
How to Choose the Right Software Quality Metrics
Your software quality metrics should reflect your development goals, testing scope, and user expectations. Start by identifying what outcomes matter most, like faster releases, fewer production bugs, or better coverage, and then align metrics accordingly.
Follow these principles to select the right metrics:
- Tie metrics to goals: Choose metrics that help answer specific questions, such as how stable your builds are or how fast you detect and resolve bugs.
- Balance coverage and depth: Include both test activity metrics, like test coverage, and outcome-based metrics like defect leakage.
- Avoid surface-level metrics: Don’t rely on metrics that appear impressive but offer little insight into product quality or team performance. Every metric should have a clear purpose.
- Focus on actionability: Choose metrics that lead to concrete decisions, highlight problems, or help optimize testing efforts.
- Refine as you scale: Regularly reevaluate your metrics to ensure they align with your process, goals, and product maturity.
Also Read: How to determine the Right Testing Metrics
Why Use BrowserStack to Measure Software Quality Metrics?
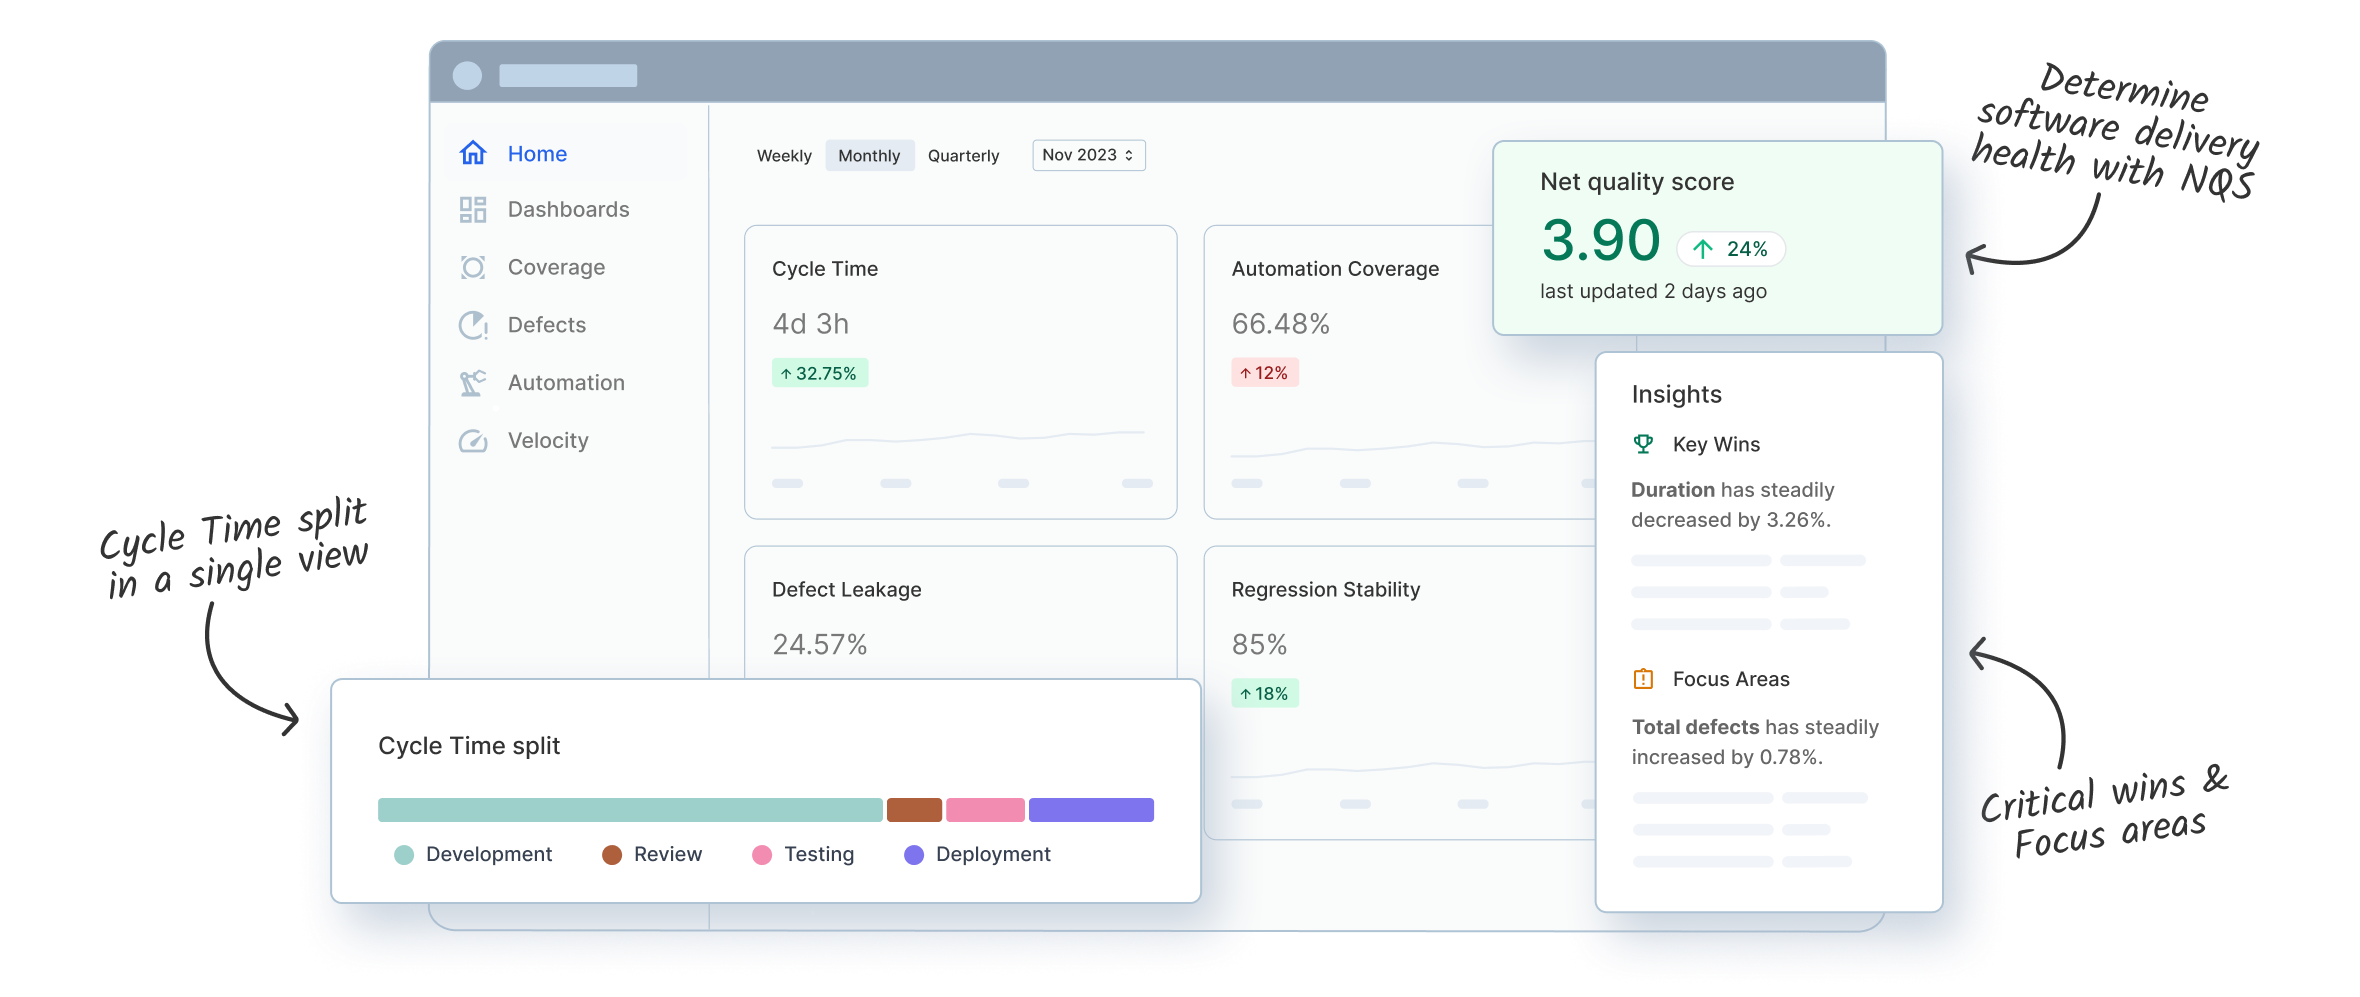
BrowserStack Quality Engineering Insights helps teams track and analyze key software quality metrics. It provides pre-built, customizable dashboards that pull real-time data from your CI/CD and testing pipelines. This allows teams to monitor trends, identify bottlenecks, and make informed decisions without setting up complex reporting systems.
BrowserStack Quality Engineering Insights tracks metrics like:
- Automation Coverage: Measure the percentage of test cases that run through automation to assess testing efficiency and reduce manual effort.
- Defect Leakage: Compare the number of defects reported after release to those caught during testing to spot gaps in test effectiveness.
- Cycle Time: Track the time from code commit to production release to evaluate speed and spot delivery delays.
- Regression Stability: Measure how often new code causes existing tests to fail, to understand if recent changes are breaking previously stable features.
- Cycle Time: Track the time from first commit to release, including time spent in development, review, testing, and deployment.
Conclusion
Software quality testing metrics provide clear visibility into how well your testing efforts support product stability, performance, and reliability. By tracking metrics across coverage, defects, effort, and ROI, teams can identify risks early, prioritize improvements, and ensure that testing aligns with business goals.
BrowserStack offers ready-to-use, customizable dashboards that track key metrics like automation coverage, defect leakage, and cycle time. With real-time data from your CI/CD workflows, you can make informed decisions, catch issues faster, and continuously improve test quality.


