HTTP load testing is an essential aspect of software engineering, which looks into how web applications and services react under different traffic conditions.
By mimicking how a real user operates a system, it can help the organization to find performance bottleneck issues in time and ensure that the application can handle the expected load of users without any degradation in service.
Overview
Top HTTP Load Testing Tools
- BrowserStack Load Testing
- Wrk
- K6
- Jmeter
- Autocannon
- Bombardier
- SlowHTTPTest
- Tsung
- Drill
- LoadRunner
- H2load
- Taurus
- Locust
- Apache JMeter
- Seige
- Fortio
This guide explores HTTP load testing, its significance, and the top tools for performing it.
What is Http Load Testing?
HTTP load testing is a specific type of load testing focused on measuring the performance of web servers, APIs, or web applications by simulating user traffic through HTTP requests. While both terms overlap, HTTP load testing is a subset of general load testing.
Load testing itself is a broader performance testing technique used to evaluate how any system (not just those exposed over HTTP) handles a defined volume of virtual users or requests, assessing key metrics like response time, throughput, and stability under expected (or slightly elevated) load conditions.
- Response Time: Latency between request initiation and server response.
- Throughput: Requests processed per second (RPS).
- Error Rates: Percentage of failed transactions (e.g., HTTP 5xx errors).
- Scalability Thresholds: Maximum concurrent users before performance degrades.
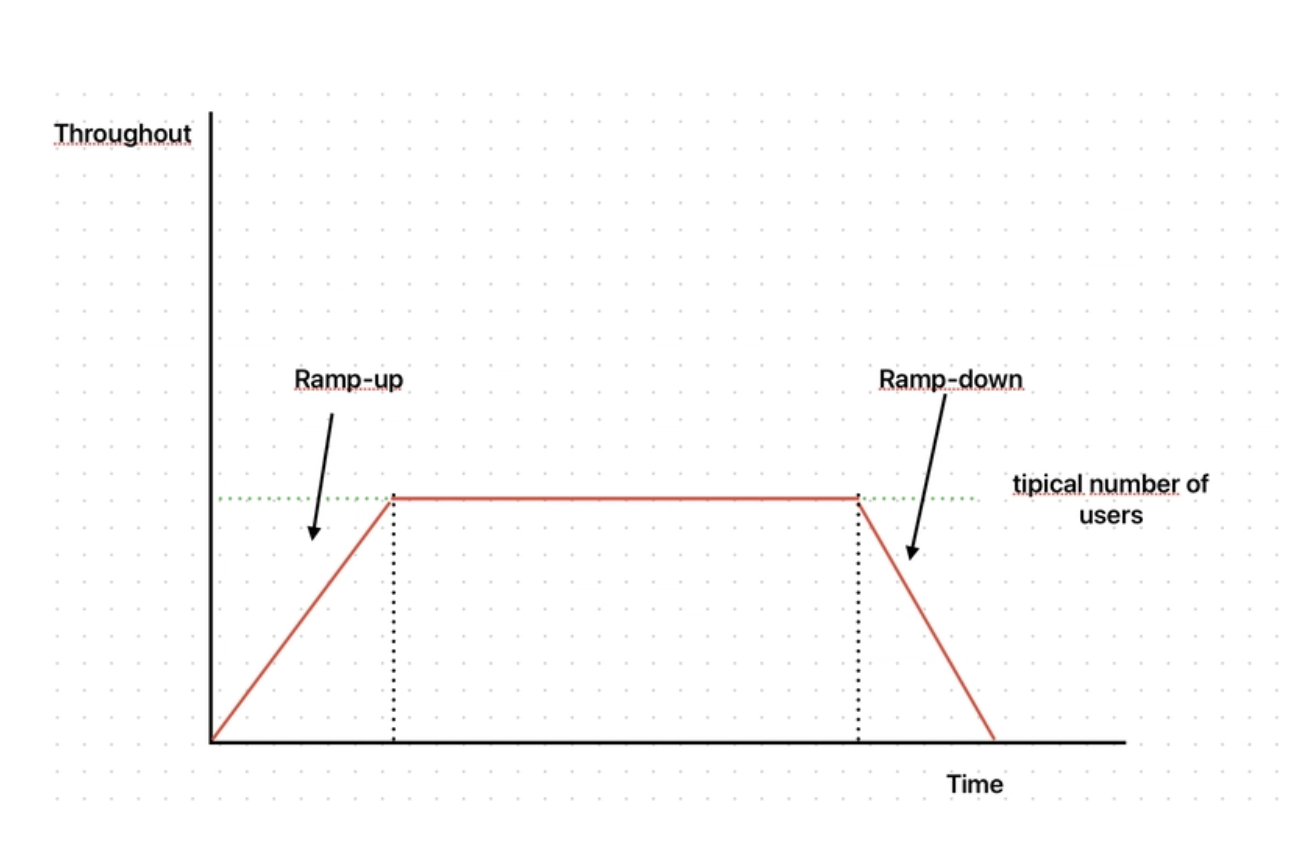
When performing load testing, it is critical to simulate realistic user behavior to obtain accurate performance measurements. This means that, in most test scenarios, the applied load should increase incrementally rather than instantaneously. Similarly, the load should not cease abruptly but instead diminish gradually.
To achieve this, load tests should incorporate two key phases:
- Ramp-up Period: The workload is progressively increased to the target level, allowing the system to adjust to rising demand.
- Ramp-down Period: The workload is systematically reduced, enabling observation of how the system scales down resources as demand subsides.
This approach provides valuable insights into the system’s elasticity—its ability to dynamically allocate and deallocate resources in response to fluctuating traffic levels. The only exception to this methodology is spike testing, where sudden bursts of traffic are intentionally generated to evaluate system resilience under extreme conditions.
Unlike functional testing, load testing focuses on system behavior under stress, mimicking scenarios like Black Friday sales or viral marketing campaigns.
Why is Http Load Testing Important?
HTTP load testing is important because it ensures that web applications and APIs can reliably handle expected and peak volumes of user traffic, preventing breakdowns and maintaining a seamless user experience. By simulating real-world scenarios, HTTP load testing identifies performance bottlenecks, validates system scalability, and enables proactive resolution of issues before they reach production.
Key Benefits of HTTP Load Testing
- Detects bottlenecks: HTTP load testing helps uncover issues such as slow database queries, inefficient code, or server misconfigurations that may degrade performance under traffic spikes.
- Prevents downtime: Early identification of weaknesses reduces the risk of outages or crashes during high-traffic events, avoiding costly disruptions to business operations.
- Enhances scalability: Load testing reveals the system’s capacity limits, empowering teams to optimize infrastructure and improve scalability before launch.
- Reduces costs: Catching problems before deployment saves expensive fixes and protects reputation, as post-launch errors are typically more costly to remedy.
- Optimizes customer satisfaction: Reliable and fast applications prevent user frustration and abandonment, directly impacting retention and business success.
Strategic Value
- SLA and reliability: HTTP load testing confirms SLAs (Service Level Agreements) are met, maintaining user trust and contractual obligations.
- Competitive edge: Organizations leveraging HTTP load testing consistently deliver robust web experiences that outperform competitors in speed and reliability.
- Infrastructure planning: Insight from load tests helps right-size resources, balancing performance needs against operational costs.
Accurate HTTP load testing is vital content for technical documentation—especially for SaaS and API-driven offerings where performance directly influences user retention and business growth.
Including real-world load testing scenarios and emphasizing their impact on reliability and scalability will resonate with audiences seeking assurance for high-volume digital applications.
How does Http Load Testing work?
HTTP load testing assesses a system’s performance under different traffic levels by simulating real user traffic. It ensures system stability during high-traffic events.
1. Define Testing Goals:
- Establish the objectives of the load test, like determining the maximum number of concurrent users the application can handle or ensuring specific response times are met.
- Identify the key performance indicators (KPIs) to monitor, such as response times, error rates, and resource utilization.
2. Determine Load Parameters:
- Define the workload and user traffic to simulate.
- Model the expected user behavior, including peak usage times.
3. Choose the Right Tools:
- Select a load testing tool that supports the necessary protocols and technologies (e.g., HTTP, HTTPS, WebSocket). Some popular tools include Apache JMeter, k6, LoadRunner, and WebLOAD.
4. Create Test Scenarios:
- Develop test scripts that mimic actual user behavior and interactions with the application.
- Incorporate realistic user actions and data.
5. Run the Test:
- Execute the load test by gradually increasing the number of virtual users (load).
- Monitor the system’s performance and stability during the test.
6. Analyze the Results:
- Examine the collected data to identify performance bottlenecks and areas for improvement.
- Analyze metrics such as response times, error rates, throughput, and resource utilization.
7. Optimize the System:
- Implementing necessary changes to address identified performance issues, such as code optimizations, infrastructure upgrades, or configuration adjustments.
8. Retest and Validate:
- After optimizations, re-run the load test to verify that the changes have improved performance and resolved the identified issues.
Top Load Testing Tools
Here are the top load testing tools:
1. BrowserStack Load Testing
BrowserStack Load Testing is a cloud-based solution designed to help teams measure, analyze, and optimize application performance with precision and ease. It focuses on providing real-world performance insights across multiple devices and browsers.
Key Features:
- Simulate Real-World Traffic: Generate thousands of virtual users from different geographies to replicate actual usage scenarios without complex infrastructure.
- Unified Reporting & Analytics: Access detailed logs, snapshots, and video recordings to detect bottlenecks and optimize performance.
- CI/CD Integration: Seamlessly integrate with your pipeline to run automated performance tests and catch regressions early.
- Test Sharding & Distribution: Split large test suites into smaller batches and run them in parallel for faster results and efficient resource use.
- Comprehensive Device & Browser Coverage: Test across 3500+ real devices and browsers to ensure consistent performance across environments.
- Real Device Testing: Gain accurate performance insights by testing on actual devices, reflecting real user conditions.
Pros:
- Provides real-world performance insights across multiple devices and browsers.
- Reduces test execution time with parallel testing and test sharding.
- Offers detailed analytics and reporting for effective troubleshooting.
- Integrates easily with existing CI/CD pipelines for automated performance validation.
2. Wrk
Wrk is an open-source HTTP benchmarking tool written in C, known for its high performance and multi-threaded capabilities. It focuses on providing accurate and efficient benchmarking for web applications.
Key Features:
- HTTP/1.1 Support: Ideal for testing diverse web applications.
- Multi-Threaded Design: Optimizes performance and concurrency for realistic load simulation.
- Lua Scripting: Enables custom, complex test scenarios through scripting.
Pros:
- Multi-threaded architecture handles high traffic effectively.
- Lua scripting offers unmatched flexibility for tailored workflows.
Cons:
- Less intuitive for users preferring graphical interfaces.
- Advanced scripting requires familiarity with Lua, adding initial complexity.
3. K6
k6 is a modern, developer-centric load testing tool that focuses on testing back-end infrastructure performance. It is built with Go and JavaScript, allowing seamless integration into developers’ workflows and continuous integration pipelines.
Key Features:
- JavaScript/ES6 Scripting: Write test scenarios in familiar JavaScript/ES6 syntax.
- Multi-Protocol Support: Test HTTP/1.1, HTTP/2, WebSocket, and gRPC-based services.
- xk6-Browser Hybrid Testing: Automate browser actions (e.g., clicks, form submissions) and measure front-end metrics like first contentful paint.
Pros:
- JavaScript scripting lowers the barrier for developers.
- Simplifies automated performance testing in DevOps workflows.
- xk6-browser unifies API and browser-level tests for full-stack insights.
Cons:
- Advanced visualization requires third-party tools or paid plans.
- xk6-Browser is currently limited to Chromium; other browsers are pending.
- Advanced capabilities (e.g., distributed testing) require a paid subscription.
4. Gatling
Gatling is a powerful, open-source load testing tool primarily designed for testing web applications and APIs. Built on Scala, Akka, and Netty, Gatling emphasizes high performance, developer-friendly scripting, and automation-ready integrations. Its non-blocking architecture allows it to simulate thousands of concurrent users with minimal resource consumption.
Key Features:
- Protocol Support: Primarily supports HTTP/HTTPS, WebSockets, JMS, and gRPC (via plugins).
- Developer-Centric Scripting: Test scenarios written in expressive Scala-based DSL or Java DSL (with recent versions).
- Powerful Reporting: Automatically generates detailed HTML reports with interactive graphs.
- Lightweight & Efficient: Built on asynchronous architecture to support high concurrency with low resource usage.
- Automation Friendly: Easily integrates with CI/CD pipelines (Jenkins, GitHub Actions, etc.).
- Simulation as Code: Promotes version-controlled test scripts for maintainability and reuse.
- Open-source Core with Commercial Enhancements: Gatling Enterprise provides advanced features for teams.
Pros:
- Highly efficient for simulating large-scale user loads without overloading test infrastructure.
- Clean, code-driven approach suitable for developers and DevOps teams.
Excellent reporting out of the box. - Easy integration with build and automation pipelines.
- Modern, event-driven architecture optimized for performance.
Cons:
- Steeper learning curve for non-developers due to code-based test creation.
- Limited protocol support compared to tools like JMeter (primarily focused on HTTP/Web APIs).
- Requires knowledge of Scala or Java DSL for advanced scenarios.
- UI-driven test design is only available in Gatling Enterprise (paid).
Read More: Top 20 Essential Website Testing Tools
5. Autocannon
Autocannon is a high-performance, Node.js-based HTTP/HTTPS benchmarking tool Designed for simplicity and speed, it leverages Node.js worker threads to execute thousands of requests per second.
It operates as both a command-line utility and a programmable API, making it ideal for developers seeking rapid load testing and integration into JavaScript workflows.
Key Features:
- HTTP/HTTPS & Pipelining Support: Benchmarks HTTP/1.1, HTTPS, and HTTP pipelining for efficient request handling.
- Programmable API & CLI: Use via JavaScript code or standalone CLI for flexibility in testing workflows.
- Scalable Load Generation: Simulates high concurrency with configurable connections, rates, durations, and timeouts.
- Node.js Optimization: Utilizes worker threads to maximize throughput and outperform many traditional tools.
Pros:
- Node.js architecture and worker threads enable exceptional request rates.
- Seamless integration with JavaScript/Node.js ecosystems and npm workflows.
- Fine-tune parameters like connection limits, ports, and request thresholds.
Cons:
- Focused solely on HTTP/HTTPS; lacks support for WebSocket, gRPC, or other protocols.
- Requires Node.js runtime, limiting use in non-JS environments.
- Provides raw metrics without advanced visualization or analysis tools.
6. Bombardier
Bombardier is a lightweight, high-performance HTTP/HTTPS benchmarking tool built in Go, leveraging the fasthttp library for rapid request execution.
Designed for simplicity and efficiency, it supports cross-platform operation and is ideal for developers seeking quick, reliable load testing. Installation is straightforward via precompiled binaries or the Go package manager.
Key Features:
- HTTP/HTTPS Benchmarking: Tests web services with HTTP/1.1 and HTTPS protocols.
- Optimized Performance: Uses Go’s fasthttp library for minimal overhead and high throughput.
- Cross-Platform Compatibility: Runs seamlessly on Windows, Linux, and macOS.
- Configurable Load Parameters: Adjust connections, request rates, duration, and timeouts.
Pros:
- Outperforms many tools due to Go’s concurrency and fasthttp optimizations.
- Minimal resource consumption, ideal for quick tests or constrained environments.
- Precompiled binaries eliminate the need for runtime environments.
Cons:
- Focused solely on HTTP/HTTPS; no support for WebSocket, gRPC, etc.
- Lacks a GUI, requiring comfort with command-line tools.
- Tailored for HTTP benchmarking, less suited for complex multi-protocol scenarios.
Read More: Best Automation Testing Tools for 2024
7. SlowHTTPTest
SlowHTTPTest is an open-source security testing tool designed to simulate low-and-slow Denial of Service (DoS) attacks. Deliberately prolonging HTTP connections exposes server vulnerabilities and tests the maximum concurrent connection capacity, helping identify weaknesses in web server configurations.
Key Features:
- Slow Attack Simulation: Tests server resilience by delaying HTTP request completion (e.g., Slowloris, Slow POST attacks).
- Protocol Support: Targets HTTP/HTTPS servers to assess their ability to handle prolonged connections.
- Customizable Parameters: Adjust connection rates, timeouts, and headers to mimic real-world attack vectors.
Pros:
- Uniquely identifies server vulnerabilities to slow attacks, complementing traditional load testing.
- Fine-tune attack parameters for precise vulnerability assessment.
- Minimal resource requirements for targeted security tests.
- Enables proactive hardening of server defenses against DoS threats.
Cons:
- Specialized for slow-attack simulation, not general performance benchmarking.
- Requires command-line proficiency, lacking a GUI for ease of use.
- Focused solely on HTTP/HTTPS, excluding other protocols.
8. Tsung
Tsung is an open-source, Erlang-based distributed load testing tool designed to simulate high user concurrency and evaluate system scalability under extreme workloads.
It supports multiple protocols, including HTTP, XMPP, LDAP, SOAP, and MySQL, making it adaptable for testing diverse applications. With its distributed architecture, Tsung scales tests across clusters to generate massive traffic while monitoring client/server resources.
Key Features:
- Multi-Protocol Testing: Supports HTTP, WebDAV, XMPP, LDAP, SOAP, and MySQL for versatile application coverage.
- Distributed Load Generation: Scales tests across multiple machines to simulate millions of concurrent users.
- HTTP Recorder & Reporting: Records sessions for replay and generates HTML reports with graphs for post-test analysis.
- High Concurrency: Efficiently simulates stateless/stateful workloads to stress-test system limits.
Pros:
- Ideal for testing web apps, chat systems (XMPP), databases, and APIs.
- Distributed setup handles enterprise-level load scenarios.
- Monitors both server and client-side performance in real time.
- Simple configuration files and minimal dependencies for quick deployment.
Cons:
- Web interface lacks modern usability and visual polish.
- Custom scripting/extension requires familiarity with Erlang.
- Smaller community compared to tools like JMeter or k6.
Read More: Top 15 Manual Testing Tools
9. Drill
Drill is a lightweight, open-source HTTP load testing tool written in Rust, designed for simplicity and efficiency. Inspired by Ansible’s declarative syntax, it uses YAML configuration files to define test scenarios, requests, and concurrency levels.
Key Features:
- YAML-Driven Configuration: Define complex load tests (endpoints, headers, payloads) in easy-to-read YAML files.
- HTTP/HTTPS Focus: Benchmarks web services with support for HTTP methods and headers.
- Concurrency Control: Adjust virtual users and request rates to simulate varying loads.
- Ansible-Like Syntax: Simplifies test scripting for users familiar with Ansible workflows.
- Rust-Powered Performance: Low overhead and high speed due to Rust’s memory-safe, compiled architecture.
Pros:
- Minimal resource consumption with rapid test execution.
- Install via cargo install drill; no complex dependencies.
- YAML files simplify test creation and reuse.
- Runs on any OS supporting Rust.
- Free to use, modify, and integrate into workflows.
Cons:
- Exclusively supports HTTP/HTTPS (no WebSocket, gRPC, etc.).
- Less flexible for dynamic scripting compared to code-based tools.
- Smaller community and fewer plugins compared to established tools like JMeter.
- No GUI, requiring comfort with terminal workflows.
10. LoadRunner
LoadRunner is a well-established tool in the load testing space, capable of managing thousands of virtual users simultaneously.
It supports a variety of protocols and technologies, making it suitable for extensive enterprise environments. LoadRunner’s comprehensive reporting and analysis features are valuable for performance testers.
Key Features:
- Protocol Support: Simulates browser and API traffic over HTTP and HTTPS protocols.
- Script Generation: Uses VuGen to record and customize user interactions for HTTP load testing.
- Scalability: Supports simulation of thousands of users to test system performance under stress.
- Performance Monitoring: Tracks server metrics like CPU, memory, and network during test runs.
- Dynamic Data Handling: Manages session data and user input using correlation and parameterization.
- Load Distribution: Spreads virtual users across multiple machines and geographies for realism.
- Network Virtualization: Simulates real-world conditions like latency and bandwidth constraints.
- Error Detection: Identifies HTTP errors and status codes to help isolate performance issues.
Pros:
- Easy-to-use GUI for script creation and test management.
- Highly scalable for enterprise-grade load testing.
- Supports a wide range of protocols beyond HTTP.
Cons:
- Expensive licensing, especially for large-scale tests.
- Steep learning curve for beginners.
- Requires powerful infrastructure for large user simulations.
11. H2load
h2load is a high-performance benchmarking tool developed as part of the nghttp2 project, specializing in HTTP/1.1 and HTTP/2 protocol testing with SSL/TLS support.
Designed for developers and administrators, it evaluates server performance under load by simulating concurrent clients and requests.
Built in C++ and tightly integrated with nghttp2, h2load requires compilation with the –enable-app flag, making it ideal for detailed HTTP/2 optimization and stress-testing.
Key Features:
- HTTP/1.1 & HTTP/2 Support: Benchmarks both protocols to compare performance and compatibility.
- SSL/TLS Encryption Testing: Validates server behavior under encrypted connections (HTTPS).
- Concurrency & Scalability: Configurable client threads (-c), total requests (-n), and multi-threaded load generation.
- Flow Control Customization: Adjust HTTP/2-specific settings like window sizes and stream prioritization.
- CLI Simplicity: Execute tests via straightforward commands (e.g., h2load -n9000 -c100 https://localhost).
Pros:
- Optimized for HTTP/2 testing, leveraging nghttp2’s robust implementation.
- Efficient C++ architecture ensures minimal resource consumption during high-load tests.
- Benefits from continuous updates and improvements within the nghttp2 ecosystem.
Cons:
- CLI-only interface limits accessibility for those preferring visual tools.
- Exclusively focuses on HTTP/1.1 and HTTP/2 (no WebSocket, gRPC, etc.).
- Requires familiarity with HTTP/2 concepts and command-line syntax for optimal use.
12. Taurus
Taurus is an open-source, automation-centric framework that simplifies continuous performance testing by abstracting the complexity of tools like JMeter, Gatling, Locust, and Selenium.
It enables teams to define tests in YAML/JSON—a human-readable, code-review-friendly format—making performance testing accessible to non-experts.
Key Features:
- YAML/JSON Scripting: Declarative test configuration for scenarios, thresholds, and parameters in simple text files.
- Multi-Tool Abstraction: Run tests via JMeter, Gatling, Locust, or Selenium without deep expertise in each tool.
- CI/CD Integration: Native compatibility with Jenkins, TeamCity, and other pipelines for automated testing.
- Collaboration-Friendly: Readable YAML syntax encourages team contributions and version control.
Pros:
- YAML reduces scripting barriers, enabling broader team participation.
- Leverage existing tools (e.g., JMeter scripts) without vendor lock-in.
- Centralizes test execution and results across multiple tools.
Cons:
- Requires understanding YAML structure and tool-specific parameters.
- Advanced features may lack detailed guides, relying on community support.
- Inherits limitations of integrated tools (e.g., JMeter’s resource demands).
Read More: Top 20 Performance Testing Tools
13. Locust
Locust is another open-source load testing tool that adopts an event-based architecture, making it more resource-efficient compared to traditional thread-based tools like JMeter. Locust allows users to define their test scenarios using Python, which adds a layer of flexibility for developers.
Key Features:
- Python Scripting: Write test scenarios as Python code for granular control over user flows and logic.
- Protocol Agnostic: Test HTTP, WebSocket, or custom protocols by scripting interactions.
- Extensible via Plugins: Enhance functionality with community-driven plugins (e.g., CSV reporting, OAuth support).
Pros:
- Python syntax lowers barriers for developers and integrates with CI/CD pipelines.
- Effortlessly distribute load across worker nodes for enterprise-level testing.
- Robust plugin ecosystem and frequent updates driven by open-source contributions.
Cons:
- Requires Python knowledge to script complex scenarios, limiting non-developers.
- While flexible, it demands custom code for non-HTTP/WebSocket protocols.
- Relies on manual scripting instead of GUI-based test recording.
14. Apache JMeter
Apache JMeter is one of the most widely used open-source load testing software applications. It is specifically designed for load testing and can measure application performance and response times effectively. JMeter is recognized for its sophisticated features and is often seen as an open-source alternative to commercial tools like LoadRunner. Its user interface relies heavily on right-click actions, making it powerful yet somewhat unique in its operation.
Key Features:
- Multi-Protocol Support: Tests HTTP/HTTPS, FTP, JDBC, LDAP, SOAP/REST, TCP, SMTP, and Java-based applications.
- Flexible Scripting: IDE for test recording/debugging; Groovy as default scripting language (since v3.1); Java DSL for code-driven tests.
- GUI & CLI Execution: Build tests via GUI and run them in CLI mode for efficiency.
- Extensibility: Expand functionality with plugins for custom metrics, listeners, and integrations.
- Mobile & Distributed Testing: Supports mobile app performance testing and distributed load generation (with setup effort).
Pros:
- Versatile for testing APIs, databases, web apps, and more.
- Rich resources, tutorials, and plugins due to widespread adoption.
- Runs on any OS with Java support.
- Fully open-source with no licensing fees.
- Intuitive interface for test creation and visualization.
Cons:
- Complexity in advanced scripting and distributed setups may overwhelm new users.
- Demands significant CPU/memory for large-scale tests, impacting local machine performance.
- Distributed testing requires manual configuration of multiple machines and network coordination.
- Metrics are post-processed, lacking real-time insights during test execution.
Read More: Performance Testing Vs Load testing
15. Seige
Siege is a lightweight, open-source HTTP/HTTPS load testing tool designed for simplicity and speed.
Operating via command-line interface (CLI), it focuses on benchmarking web servers by simulating concurrent user traffic, measuring performance metrics like transaction rates, and identifying bottlenecks. Written in C, Siege is ideal for quick, scriptable tests and integrates easily into automated workflows.
Key Features:
- HTTP/HTTPS Testing: Evaluates web server performance for GET/POST requests and supports cookies, headers, and basic authentication.
- Concurrent User Simulation: Configurable concurrency levels (-c) to mimic multiple simultaneous connections.
- Customizable Load Parameters: Set test duration (-t), repetitions (-r), and delays between requests.
Pros:
- Minimal setup and quick execution for rapid feedback.
- Runs on Linux, macOS, and Windows (via Cygwin/WSL).
- Test URL lists from files for repeatable scenarios.
Cons:
- No support for WebSocket, gRPC, or other modern protocols.
- CLI-only interface may deter non-technical users.
- Not designed for distributed or massive-scale testing.
- Less flexibility for dynamic, stateful user behavior compared to code-driven tools.
16. Fortio
Fortio is a versatile, Go-based open-source toolkit combining a load testing CLI, embeddable library, configurable echo server, and web UI. Designed for precision and efficiency, it focuses on generating controlled query-per-second (QPS) loads, capturing detailed latency distributions, and analyzing performance metrics.
Key Features:
- QPS Control: Precisely define load intensity (requests per second) for consistent stress testing.
- Latency Histograms: Visualize percentile-based latency (50th, 90th, 99th) to identify performance outliers.
- Multi-Functionality: Serve as a load tester, echo server (for debugging), or embedded Go library.
- Cross-Platform: Compact Docker image (~3MB) and standalone binaries for Linux, macOS, and Windows.
Pros:
- Optimized Go code ensures fast execution with minimal CPU/memory usage.
- Tiny Docker footprint and no bloat, ideal for CI/CD pipelines.
- Simple CLI syntax and prebuilt binaries for quick adoption.
Cons:
- Primarily HTTP/HTTPS; lacks support for WebSocket, gRPC, etc.
- Custom extensions require Go programming knowledge.
- Designed for single-node testing; no native distributed load generation.
Types of Load Testing
Several approaches to load testing focus on measuring an application’s performance under anticipated loads. The major ones are endurance testing, spike testing, and stress testing.
1. Baseline Testing
Baseline testing is set up before any alteration or enhancement has been made to a system’s performance to acquire a standard against which subsequent changes in performance can be accurately measured and to ensure that follow-up changes do not degrade the system’s performance.
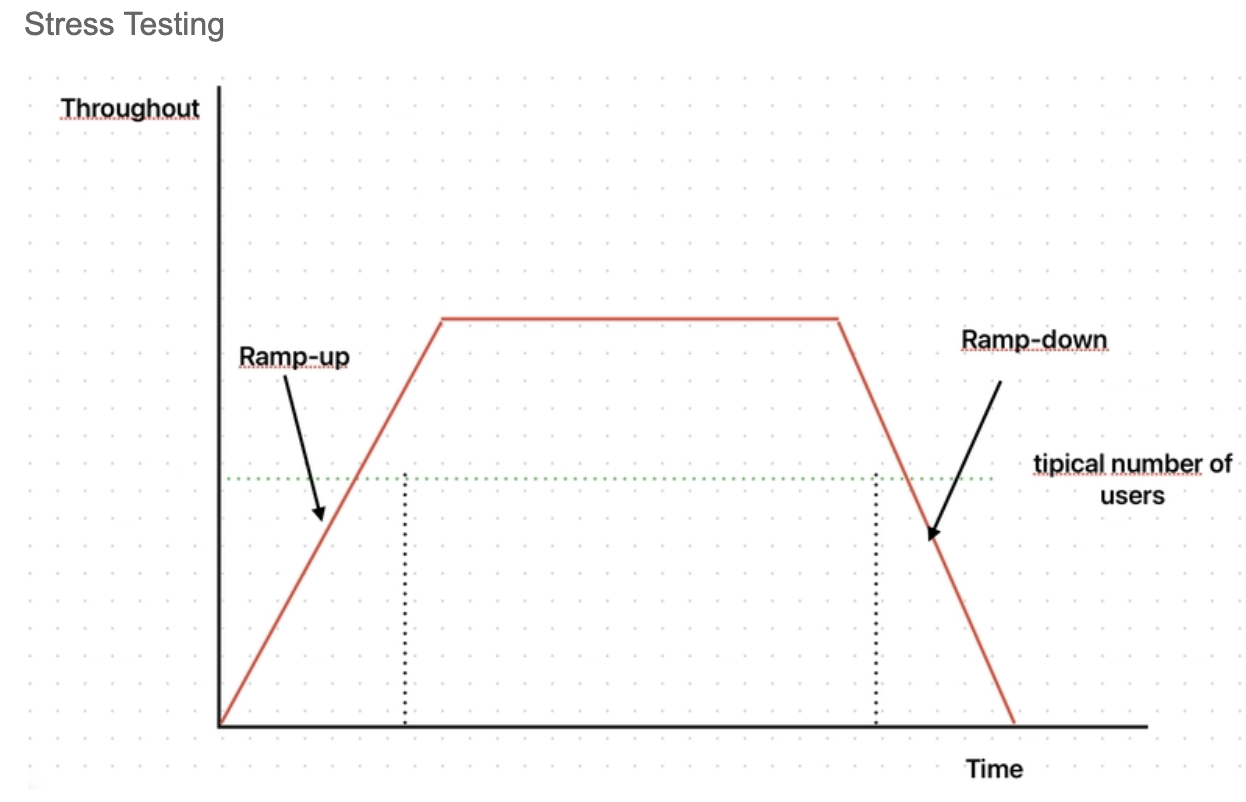
2. Stress Testing
Stress testing evaluates how the system behaves under loads exceeding the limits specified for the system, thus identifying where the application breaks and performance issues can be rectified before they happen in reality.
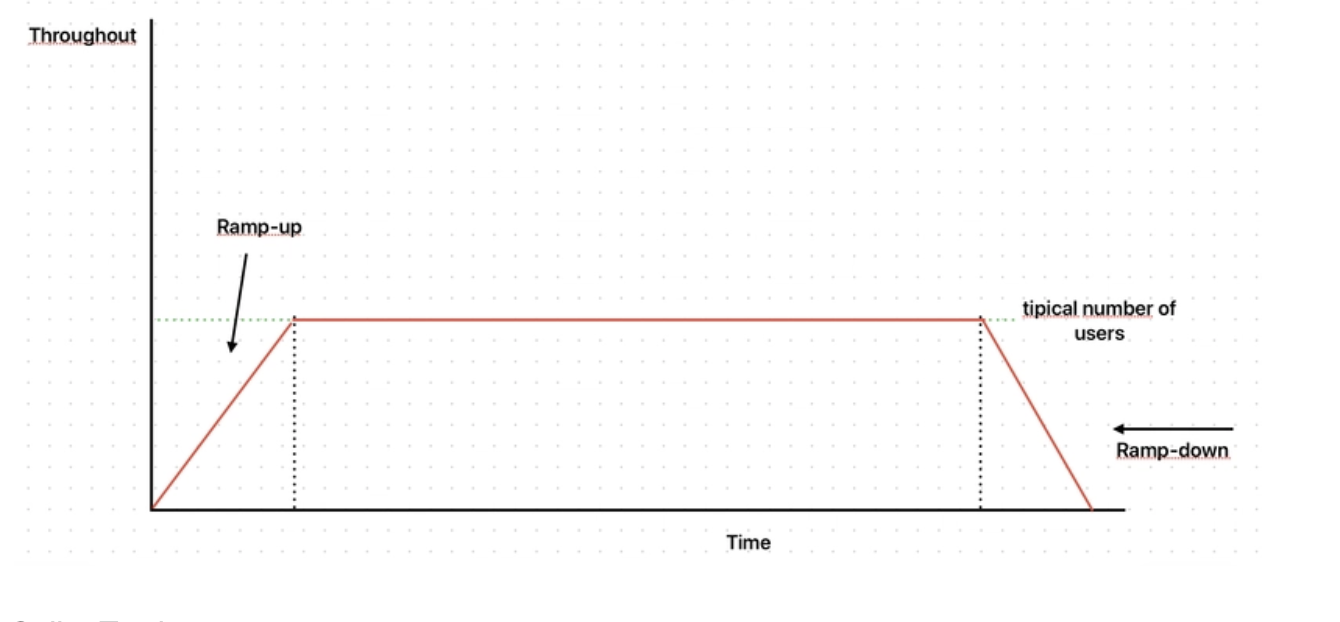
3. Endurance Testing
Endurance testing, also referred to as capacity testing or soak testing, determines how much a system can withstand a continued workload for a long time. Such testing would be significant for applications expected to give a steady performance over long user sessions or during high volumes of traffic.
4. Spike Testing
Spike testing is suddenly introducing sudden, extreme increases in load to the system. This simulates cases in practice where a high number of users suddenly choose to use an application. This will help to determine whether the application can successfully recover from heavy loads.
5. Scalability Testing
Scalability testing states whether the system could scale up or down amid a higher or lower load. This would be useful as a further understanding of how the application would cope with future growth without causing a degradation in performance.
Phases of a Load Test
Load testing is primarily aimed at establishing how the system behaves when subjected to normal and maximum loads; it determines the extent to which a system functions when exposed to a given load, which is critical because of the expected different levels of user traffic in any given period.
Key Metrics to Monitor
In load testing, several important parameters are tracked in order to understand the performance of the system:
- Response Time: This measures how long it takes for the system to respond to user requests. Analyzing response times across different percentiles (p90, p95, p99) provides deeper insights into user experience, revealing whether a small percentage of users may experience significantly longer wait times despite a favorable average.
- Error Rate: This is the percentage of requests that result in errors; a high error rate indicates an output-stability problem requiring mostly immediate attention while scaling user traffic.
- Throughput: The number of transactions processed in a certain period of time. It helps to understand how well the system will work under load.
- Resource Utilization: Holding CPU and memory information, such as usage, will show bottlenecks and inefficiencies in allocating resources that directly affect the application’s performance. Monitoring network metrics can also help reveal bandwidth constraints that may hinder performance.
Read More: Response Time Testing in Software Testing
Execution of Load Testing
The load testing process typically involves several key steps:
- Test Planning: This phase consists of defining the pre-emptive goals and expected user load scenarios. In this phase, the right workload is selected and the testing environment is set up with the appropriate configuration of load-generators.
- Scripting: Write user behavioral actions involving the application usage in scripts as they should typically occur in real life. Such scripts must be instructive to automatically think like those using real users’ actions by the simulation.
- Execution: exec load test ramped with increasing user load while monitoring the system performance to identify how the system behaves under increased traffic load.
- Monitoring and Analysis: The process of monitoring key metrics continuously in real-time for performance that may not be immediately visible is followed after running the tests. It analyzes the data collected from the tests to derive trends, bottlenecks, and potential improvements.
Detailed reports can form the basis for action for decision-makers and the methodology for future optimization. - Optimization: Implement application performance changes as determined from load testing results. It may be code optimizations, infrastructure upgrades or architectural changes that improve responsiveness and stability under load.
Conclusion
Load testing applications over HTTP is essential for software development. It empowers applications to endure real-world traffic and yet run at an optimum performance level. However, in addition to getting these synthetic load testing insights, the process should also include testing on real devices for all those variabilities like network conditions, fragmentation of devices, and OS behavior.
As digital experiences become more complex, HTTP load testing will grow further into CI/CD pipelines, lining up incorporation with AI-driven analytics to enhance the practice of performance engineering.

