Latency and throughput are important performance metrics to evaluate the responsiveness and efficiency of a system or network.
Overview
What is a Throughput vs Latency Graph
A throughput vs latency graph visualizes the relationship between how much data a system processes (throughput) and how quickly it responds (latency).
Key Aspects of Throughput vs Latency Graph
- Axes: Latency on the X-axis; throughput on the Y-axis.
- Relationship: As throughput increases, latency often rises—indicating performance strain.
- Optimal Point: Ideal performance is high throughput with low latency, though often a trade-off.
- Graph Shape: Varies by system; influenced by load, network congestion, or resource limits.
Why It Matters
- Performance Analysis: Shows how system behavior changes with load and configuration.
- Optimization: Helps pinpoint where tuning is needed to balance speed and capacity.
- System Design: Informs design choices to handle real-world traffic efficiently.
This article covers how to read, analyze, and use throughput vs latency graphs to improve system performance and scalability.
What is Latency?
Latency is the time a system takes to respond after a request is made. It starts when a request is sent and ends when the response begins.
Low latency means faster response times and a better user experience, while high latency can cause delays or lag, which is especially critical in real-time applications like video calls or gaming.
In performance testing, monitoring latency helps identify slow points, optimize backend processes, and ensure smooth app performance across devices and networks.
Must Read: Response Time Testing in Software Testing
What is Throughput?
Throughput is the quantity of requests that a system can process within an interval. While latency concerns speed, throughput concerns volume. Throughput informs you how much work your app can handle when under load.
In software testing, high throughput indicates that your system can serve more users or transactions without failure. It is an essential indicator of scalability and informs you how well the application will perform during heavy traffic.
Throughput monitoring enables QA teams to detect capacity thresholds. Throughput monitoring also assists in infrastructural planning needs and keeps the application stable under high demand.
Latency vs Throughput: Key Differences
Some of the differences between latency and throughput are:
| Aspect | Latency | Throughput |
|---|---|---|
| Definition | Time taken for a single operation or request to complete | Number of operations or requests processed per unit of time |
| Focus | Speed of individual transactions | Volume of transactions over time |
| Measurement Unit | Milliseconds (ms) or seconds | Requests per second (RPS), transactions per second (TPS), or bits per second (bps) |
| Impact on Users | Affects responsiveness and user experience | Affects system capacity and scalability |
| Ideal Scenario | Lower latency is better for real-time responsiveness | Higher throughput is better for handling more load |
| Use Cases | Critical for applications like gaming, VoIP, and real-time systems | Important for applications like file transfers, streaming, and batch processing |
| Influence on System | Indicates how quickly a system responds to a single request | Indicates how much work a system can handle over time |
Understanding the Importance of Latency and Throughput
Latency and throughput are critical metrics impacting application performance and user satisfaction. Failing to monitor or optimize either can result in poor scalability and unreliable user experiences.
- Latency Affects User Experience: High latency leads to noticeable delays, making applications feel unresponsive and frustrating to users.
- Throughput Determines System Capacity: Low throughput limits the number of simultaneous requests a system can handle, increasing the risk of crashes or timeouts under load.
- Both Metrics Are Interdependent: Optimizing latency without considering throughput can lead to system bottlenecks, and vice versa.
- Balance Is Essential in Testing: Effective testing must evaluate speed and capacity to accurately reflect real-world usage.
- Real Device Testing Captures Real User Conditions: Testing on actual browsers, networks, and devices helps reveal how latency and throughput behave under real-world scenarios.
Also Read: Performance Testing Vs Load testing
How to Measure Throughput and Latency?
Once you understand the importance of latency and throughput, the next step is to measure them accurately. This ensures that your application performs well under various conditions.
Measuring Latency
To measure latency, you can use tools like:
- Ping: Sends packets to a server and measures the time until a response is received.
- Traceroute: Identifies each hop a packet takes to reach its destination, helping locate delays.
- Netperf: Performs request-response tests to measure round-trip latency.
- iPerf: Tests network performance, including latency, by generating traffic between two systems.
Measuring Throughput
Some tools you can use to measure throughput are:
- JMeter: Simulates multiple users to test how many requests your application can handle.
- LoadRunner: Generates virtual users to assess system performance under load.
- k6: A modern tool for load testing, providing insights into throughput and other metrics.
Key Factors That Influence Latency and Throughput
Latency and throughput are closely linked but influenced by different variables. Understanding what affects each helps teams optimize system performance more effectively.
Factors That Affect Latency:
- Network Distance: Greater physical distance between client and server increases round-trip time.
- Transmission Delays: Time spent sending data across the network affects response speed.
- Processing Time: Backend operations, like database queries or API logic, add delay.
- Packet Loss and Retransmission: Lost or corrupted packets slow down communication by requiring retries.
- DNS and SSL Handshakes: Additional steps during request initiation add to the overall latency.
Factors That Affect Throughput:
- Bandwidth Availability: Higher bandwidth allows more data to be transmitted in parallel.
- Concurrency Limits: Thread or connection limits cap the number of simultaneous operations.
- Application Bottlenecks: Unoptimized code, database locks, or blocking tasks reduce processing capacity.
- Server Resources: Limited CPU, memory, or I/O impacts how many requests a system can handle.
- Protocol Overhead: Excessive headers or encryption/decryption steps reduce data throughput.
Also Read: Guide to UI Performance Testing
While latency measures how fast each operation completes, throughput measures how much a system can handle over time. Optimizing both requires addressing the factors specific to each.
Throughput vs. Latency Graphs: Visualizing Performance Metrics
In performance testing, graphs are vital tools for visualizing and interpreting key metrics. Throughput and latency graphs provide insights into an application’s capacity and responsiveness.
Understanding these graphs aids in identifying performance bottlenecks and ensuring optimal user experience.
What Is a Throughput Graph?
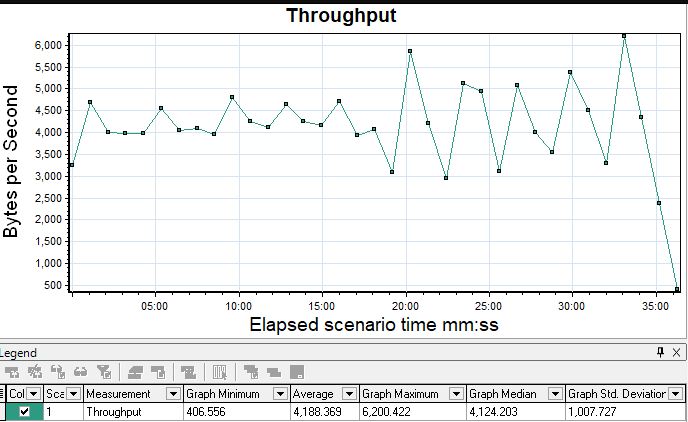
A throughput graph illustrates the volume of data or number of transactions processed by a system over time. It helps assess the system’s capacity to handle concurrent operations.
Here’s an example of a throughput graph created using Loadrunner:
Source: Loadrunner
- X-axis (Time): Represents the elapsed time during the test execution.
- Y-axis (Throughput): Indicates the amount of data processed, commonly measured in bytes per second (Bps) or transactions per second (TPS).
What Is a Latency Graph?
A latency graph depicts the time delay experienced in processing requests, providing insights into system responsiveness.
Here’s an example of how the latency graph is plotted:
Source: Pingmantools
- X-axis (Time): Denotes the duration of the test.
- Y-axis (Latency): Shows the response time, typically measured in milliseconds (ms).
Difference Between Throughput and Latency Graphs
While both graphs are essential for performance analysis, they focus on different aspects:
| Feature | Throughput Graph | Latency Graph |
|---|---|---|
| Purpose | Measures system capacity to process data over time | Measures responsiveness and delay in processing requests |
| Y-axis Metric | Data volume or transactions per second | Response time in milliseconds |
| Interpretation | Higher values indicate better capacity | Lower values indicate better responsiveness |
| Usage | Assessing scalability and load handling | Evaluating user experience and system responsiveness |
Throughput vs Latency Graph
This section illustrates how a system’s performance shifts under increasing load by analyzing throughput (requests processed per second) and latency (response time in milliseconds).
Example Scenario:
A simulated web application is tested under gradually increasing load levels, where each level represents more concurrent users. The goal is to measure how efficiently the system responds as demand scales.
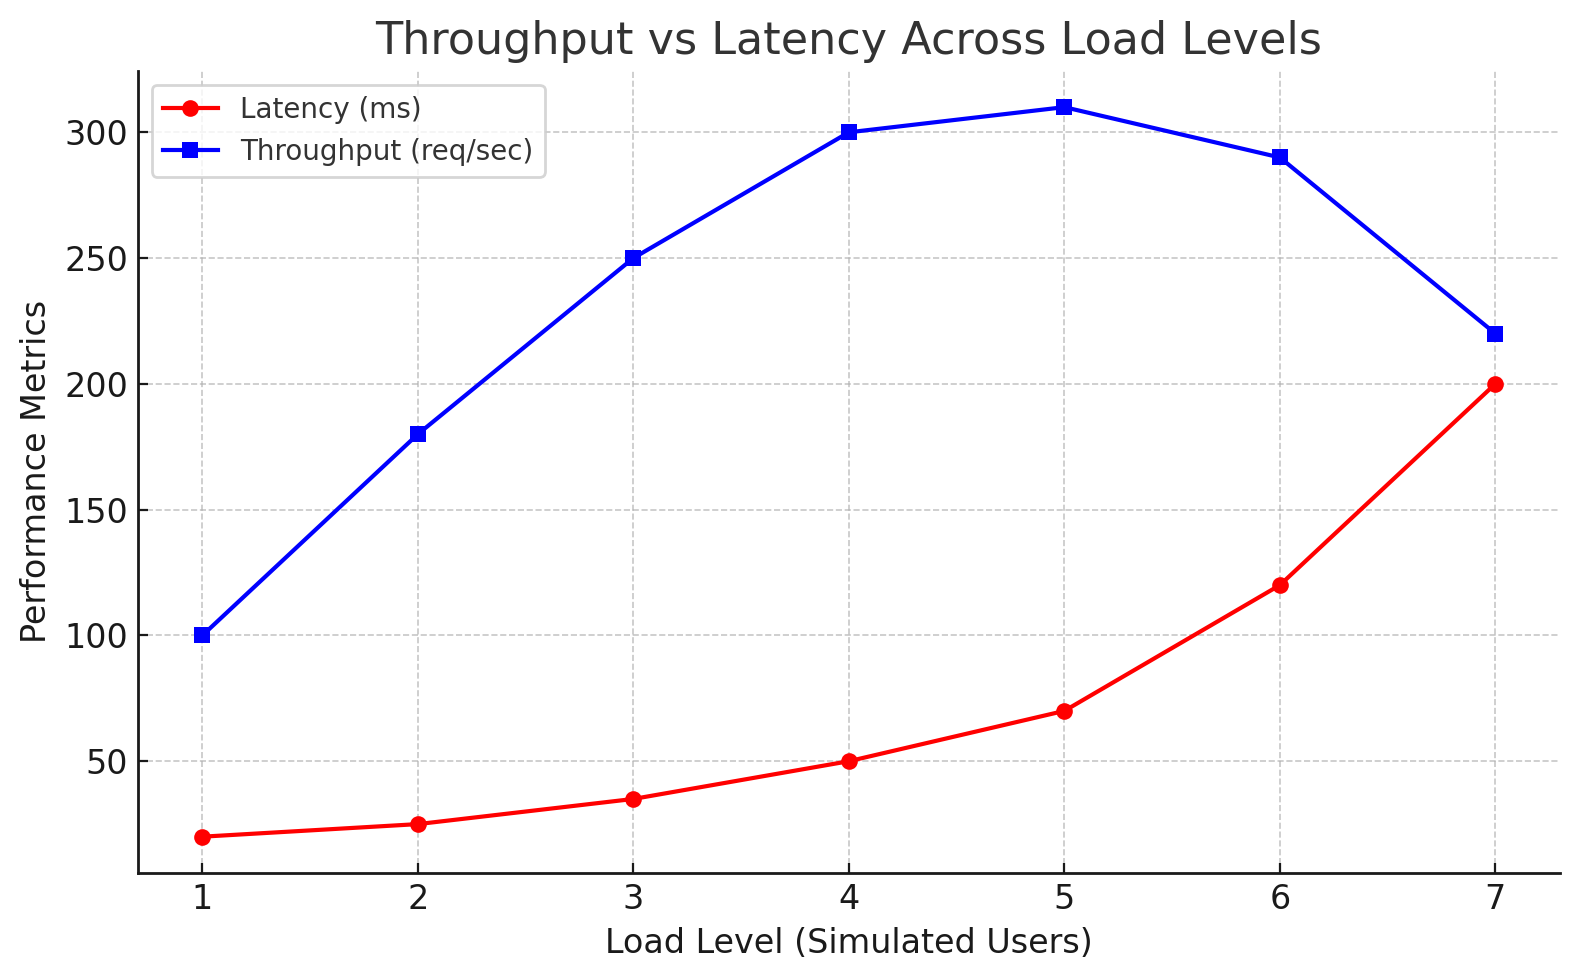
The graph plots latency and throughput across load levels to identify performance thresholds.
- Load Level 1-4: Throughput steadily increases, and latency remains low, indicating good performance.
- Load Level 5: Throughput peaks while latency rises faster, showing the system is approaching saturation.
- Load Level 6-7: Throughput declines and latency spikes, confirming system overload and performance breakdown.
Interpreting Throughput and Latency Graphs in Real Scenarios
Performance graphs aren’t just numbers on a screen. They help testers understand how systems behave under pressure. By reading them right, you can spot weak points early and avoid surprises in production.
How to Read a Throughput Graph
A throughput graph tracks the number of requests your system processes over time, helping you assess scalability and performance under load.
- Throughput Increases: The system scales well and handles traffic efficiently.
- Throughput Plateaus: The system has hit its capacity; adding load won’t improve performance.
- Throughput Declines: Indicates system overload, resources are maxed out.
- Flat Curve Under Load: Suggests a bottleneck; scaling or optimization is needed.
Reading this graph helps identify when your system performs well, is strained, and needs tuning or scaling.
How to Read a Latency Graph
Latency graphs show how long your app takes to respond. They help gauge the experience from a user’s point of view.
- Stable, Low Latency: Ideal, responses are fast and consistent.
- Gradual Increase: System is under pressure; delays may start affecting users.
- Sharp Spikes: Sign of performance issues, often due to CPU, memory, or database constraints.
If latency starts low but spikes during peak load, something’s off. You might be hitting CPU or memory limits, or a background task interferes.
Why You Should Analyze Latency and Throughput Graphs Together
Latency and throughput graphs offer different perspectives, but they only reveal the complete picture of system performance. Analyzing both helps identify bottlenecks, capacity limits, and user impact more accurately.
- High Throughput + Low Latency: Ideal performance—fast responses with high request volume.
- High Throughput + Rising Latency: System is nearing its limit; users may experience delays.
- Low Throughput + High Latency: Indicates serious bottlenecks—few requests are processed, and all are slow.
- Throughput Peaks Then Drops, While Latency Rises: Clear sign of system overload; capacity has been exceeded.
Reviewing latency and throughput graphs together ensures smarter tuning, better capacity planning, and a more responsive user experience.
Also Read: JMeter Stress Testing: A Tutorial
Tools to Generate Throughput and Latency Graphs
Selecting the appropriate tool depends on the specific requirements of your testing scenario, such as the type of application, desired metrics, and integration needs.
Combining the following tools with effective test planning ensures comprehensive performance analysis.
- Apache JMeter: Open-source tool for load testing; generates detailed latency and throughput graphs for web apps and APIs.
- LoadRunner: Enterprise-grade performance testing tool that tracks throughput and latency under large-scale load scenarios.
- k6: Developer-friendly open-source tool that captures request rates and latency percentiles with JavaScript-based scripting.
- Obkio: Network monitoring tool continuously measures latency and throughput to identify network-related performance issues.
Importance of Testing on Real Devices
Testing on real devices is critical for capturing accurate performance metrics such as latency and throughput.
Unlike emulators, real devices reflect true hardware behavior, OS-level differences, and real-world network variability, directly impacting how applications perform under load.
BrowserStack Automate provides access to a real device cloud, enabling teams to validate performance under real user conditions.
Key Benefits of Using BrowserStack Automate:
- Test on 3,500+ real devices and browsers to capture real-world latency and throughput behavior
- Automate performance testing with frameworks like Selenium and Cypress
- Debug in real time using video logs, console logs, and network logs
- Run tests in parallel to accelerate performance validation
- Ensure secure testing with enterprise-grade data protection
Also, BrowserStack Load Testing helps teams optimize application performance by simulating real-world traffic and providing detailed insights to ensure scalability and reliability under varying loads. It enables seamless integration with existing workflows and CI/CD pipelines, helping teams catch issues early and improve user experience.
Key Features:
- Simulate thousands of virtual users from multiple geographies
- Unified frontend and backend performance metrics
- Easy integration with CI/CD pipelines for automated testing
- Detect bottlenecks early and troubleshoot efficiently
- Real-time performance monitoring for both web and app environments
Best Practices to Improve Latency and Throughput
Improving both latency and throughput is essential for delivering fast, scalable, and reliable applications. Here are key strategies to boost performance across systems:
- Minimize and Bundle Network Requests: Reduce the number of API calls and use compressed formats to lower transmission time and load.
- Optimize Database and Application Logic: Use indexing, caching, and efficient algorithms to reduce processing delays and speed up data retrieval.
- Enable Asynchronous Processing: Run non-blocking background tasks to handle multiple requests without slowing down the system.
- Implement Load Balancing: Distribute traffic evenly to prevent overloading a single server or component, ensuring smoother performance.
- Use Caching and Compression: Cache frequently accessed data and compress payloads to reduce bandwidth usage and response time.
- Upgrade Hardware and Network Routing: Ensure infrastructure can handle higher loads, and optimize routing to reduce latency across data paths.
These practices work together to keep systems responsive under load while maintaining high request-handling capacity.
Conclusion
Both latency and throughput are essential metrics to evaluate a system’s performance in terms of speed and capacity.
Latency helps understand and optimise the delay or lag during data transfer across the system. Throughput refers to the data volume successfully processed within a given time.
Lower latency implies responsive systems, and a higher throughput means a system that can handle multiple concurrent requests. Understanding and exploring both latency and throughput graphs is crucial for performance testing.
With a platform like BrowserStack, you can get testing data on real devices instead of simulators, which can help you optimize your application for responsiveness and reliability.
Frequently Asked Questions
What is the Relationship Between Throughput, Latency, and Bandwidth?
Throughput, latency, and bandwidth are interconnected metrics that together define system performance:
- Bandwidth is the maximum amount of data transmitted over a network in a given time.
- Latency is the time it takes for a single data packet to travel from source to destination.
- Throughput is the actual rate at which data is successfully transferred.
Bandwidth sets the capacity, latency impacts speed, and throughput shows actual performance. High bandwidth with high latency can still mean poor throughput. Optimizing all three ensures efficient systems.


