JMeter stress testing helps determine how an application behaves under extreme load conditions, identifying its breaking point and recovery capacity. It is a key practice for validating system resilience and stability.
Overview
What is JMeter Stress Testing?
JMeter stress testing is the process of gradually increasing user load beyond expected limits to evaluate how a system performs under peak or excessive pressure. It helps identify the maximum capacity the application can handle before performance degrades or failures occur.
Why Perform Stress Testing with JMeter?
- Identify System Limits: Determines the point at which your application starts failing or slowing down.
- Assess Recovery Behavior: Evaluates how the system responds and recovers after experiencing heavy load.
- Uncover Bottlenecks: Reveals weak points in hardware, code, or configuration that cause instability.
- Validate Scalability: Ensures the infrastructure can handle unexpected traffic spikes efficiently.
How to Perform Stress Testing with JMeter
- Create a Test Plan in JMeter and add a Thread Group to simulate users.
- Gradually increase the number of threads (users) and ramp-up time to push the system beyond normal operating limits.
- Add HTTP Request Samplers to represent actual user interactions.
- Use Listeners like “View Results Tree” or “Aggregate Report” to analyze performance metrics.
- Monitor server health (CPU, memory, network) during the test to correlate system metrics with JMeter results.
This article explains how to perform stress testing with JMeter, interpret results effectively, and strengthen application stability under high-load scenarios.
What is Stress Testing?
Stress testing is a type of performance testing that evaluates how a system performs under extreme or peak load conditions. The goal of stress testing is to determine the system’s stability, responsiveness, and ability to recover when pushed beyond its normal operational capacity.
Stress Testing using Apache JMeter
Apache JMeter is a popular open-source tool widely used for stress testing web applications, APIs and services. It allows testers to simulate heavy user traffic and analyze system performance under pressure.
Stress testing using JMeter involves simulating a large number of virtual users or high request volumes to see how the application handles traffic. It helps identify performance limits, slowdowns, and potential failure points.
Key Components for Stress Testing Using JMeter
To effectively perform stress testing using JMeter, it’s important to understand its core components. Each component plays a specific role in designing, executing, and analyzing test scenarios. Here are the key components :
- Test Plan: The Test Plan is the foundation of any JMeter test. It defines the overall structure, including the sequence of test execution, configurations, and the components to be used.
- Thread Group: A Thread Group represents a group of virtual users. It lets you define the number of users, ramp-up time, and how often each user sends requests, which is essential for simulating load.
- Samplers: Samplers are used to send different types of requests to the server, such as HTTP, FTP, JDBC or SOAP. They simulate user actions and capture responses for analysis.
- Listeners: Listeners collect and display test results in various formats like tables, graphs and logs. They help in analyzing performance data during and after the test.
- Timers: Timers introduce delays between requests to simulate real-world user behavior. Without timers, JMeter sends requests one after another quickly, which may not reflect actual usage patterns.
- Assertions: Assertions are used to validate responses received from the server. They help ensure the application is returning the expected output under load.
Read More: What is Assertion Testing?
- Config Elements: Configuration elements allow you to set default values and variables used by samplers, such as server name, port, or user credentials. They help streamline the test setup and reduce repetition.
- Pre-Processors and Post-Processors: These components are used to modify requests before they are sent (pre-processors) or to handle responses after they are received (post-processors). They allow for more dynamic and flexible test scenarios.
Read More: Bug vs Error: Key Differences
JMeter Stress Testing
JMeter allows you to simulate heavy user traffic to test how your application performs under stress. By creating a test plan with thread groups, samplers and listeners, you can define the behavior and load conditions.
Once the test is set up, you can run it to observe system performance under increasing pressure. The collected data, such as response times, throughput, and error rates, helps you identify any weak points or performance limitations. This approach ensures your application can handle real-world user loads effectively and reliably.
Prerequisites
Before performing stress testing with JMeter, make sure the following requirements are met:
- Apache JMeter Installed: Ensure JMeter is properly installed and configured on your system.
- Basic Knowledge of JMeter: Understand how to create and manage test plans, thread groups, and samplers.
- Test Environment Ready: Set up a stable environment where the test can be safely executed without affecting live systems.
- Target Application Available: The application or system under test should be accessible and capable of handling load simulation.
- System Monitoring Tools: Use monitoring tools to track server resource usage, such as CPU, memory, and network, during the test.
Creating a Comprehensive Test Plan
A well-structured test plan is essential for effective stress testing in JMeter. Below are the steps to create a comprehensive test plan:
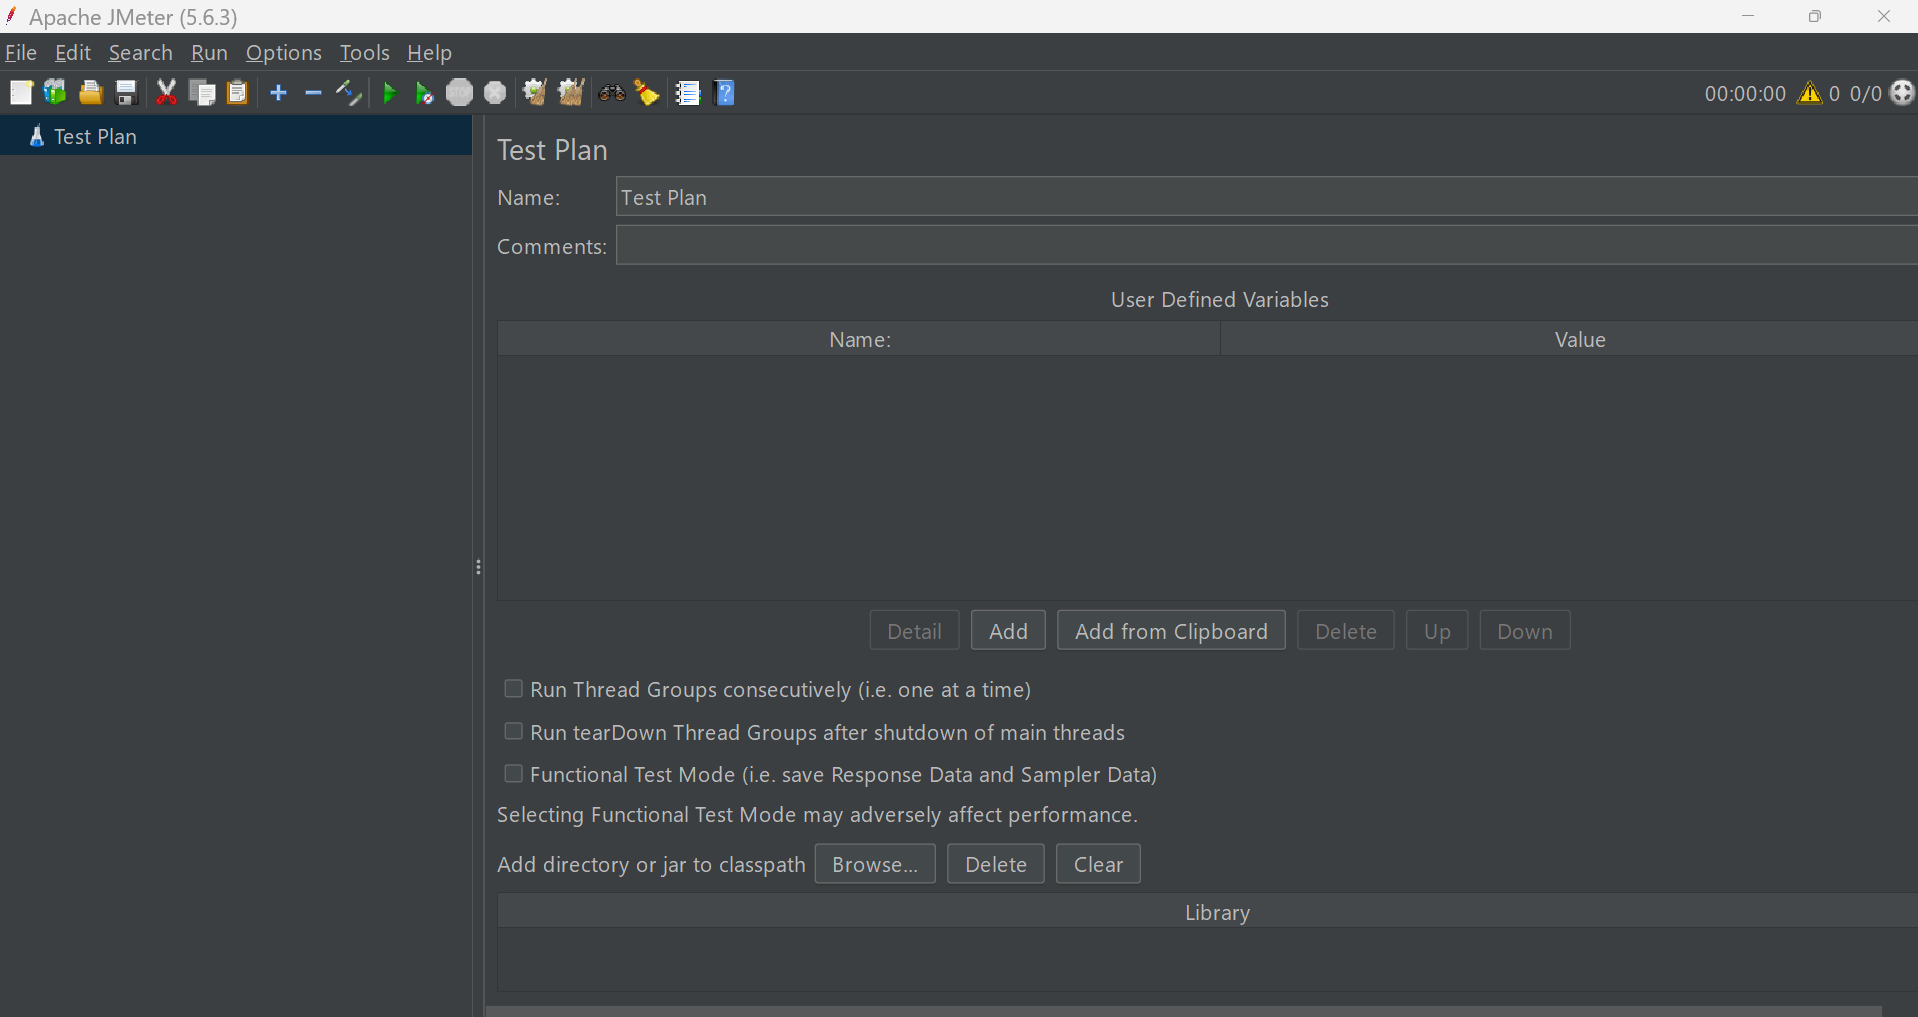
1. Launch JMeter:
Open Apache JMeter on your system to begin creating your test plan. Starting with a clean workspace helps ensure your configurations are accurate and organized.
Read More: Running JMeter Using Local Command Line
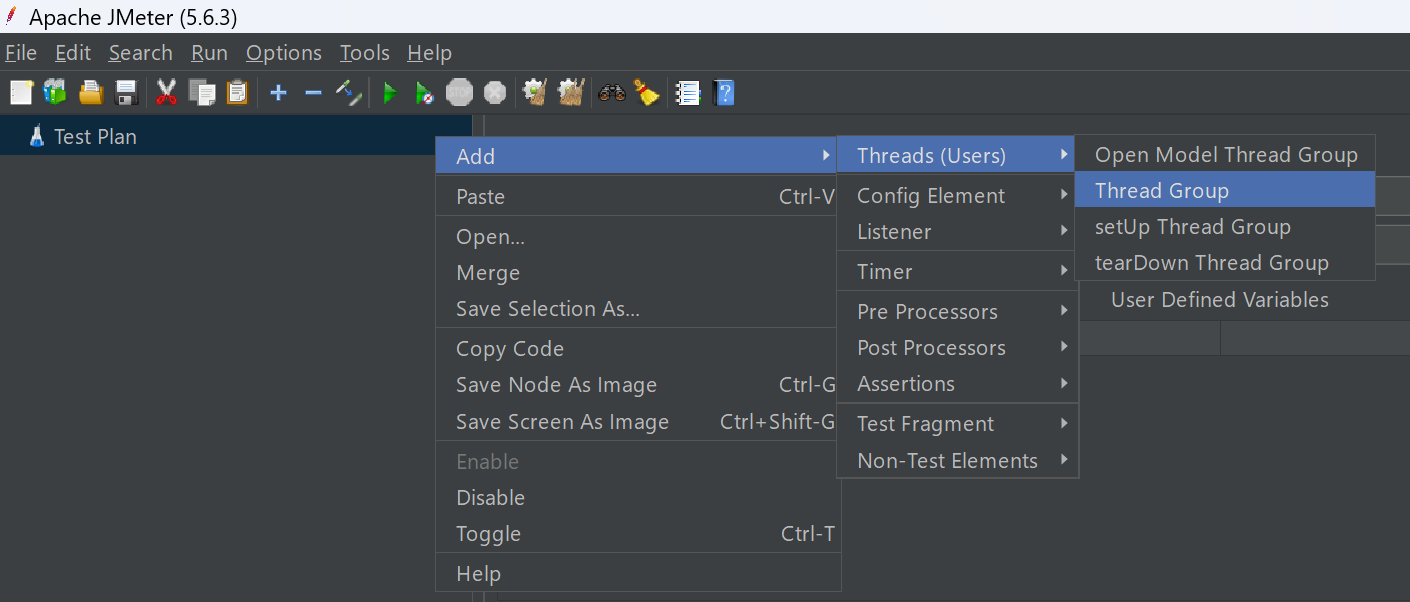
2. Add a Thread Group:
A Thread Group defines the number of virtual users, ramp-up time, and how many times each user will execute the test. It is essential for simulating user load and controlling the flow of your test.
- Right-click on the Test Plan > Click Add > Threads (Users) > Thread Group
- For this tutorial, the default values will be kept as —Number of Threads: 1, Ramp-up period: 1, Loop Count: 1
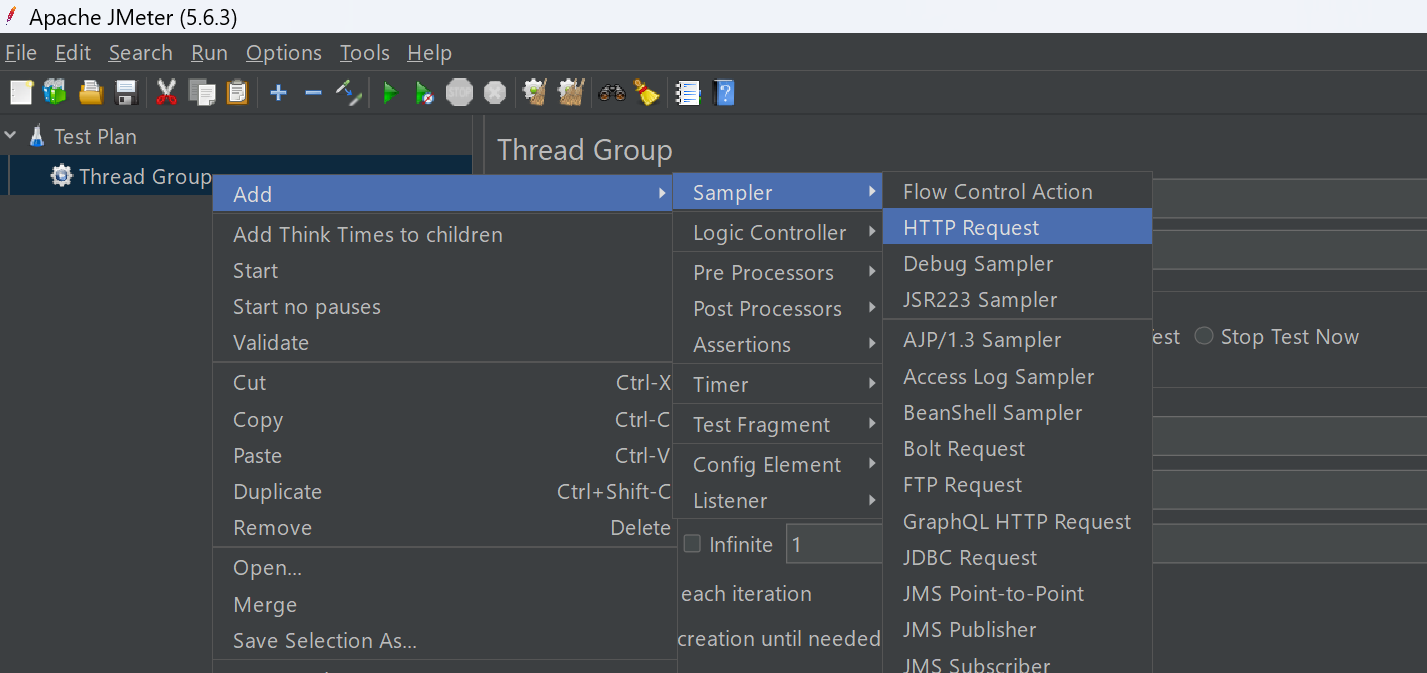
3. Insert Samplers:
Samplers are used to define the type of requests (such as HTTP or FTP) that will be sent to the server. Each sampler represents a user action you want to simulate during the test.
- Right click on the Thread Group > Click Add > Sampler.
- For this tutorial, the HTTP Request sampler will be selected.
- Add the target site URL or IP you want to test in the Server Name or IP field without http or https.
- You can change the HTTP Request type and path as needed for your project. Here,= GET request and root path will be used.
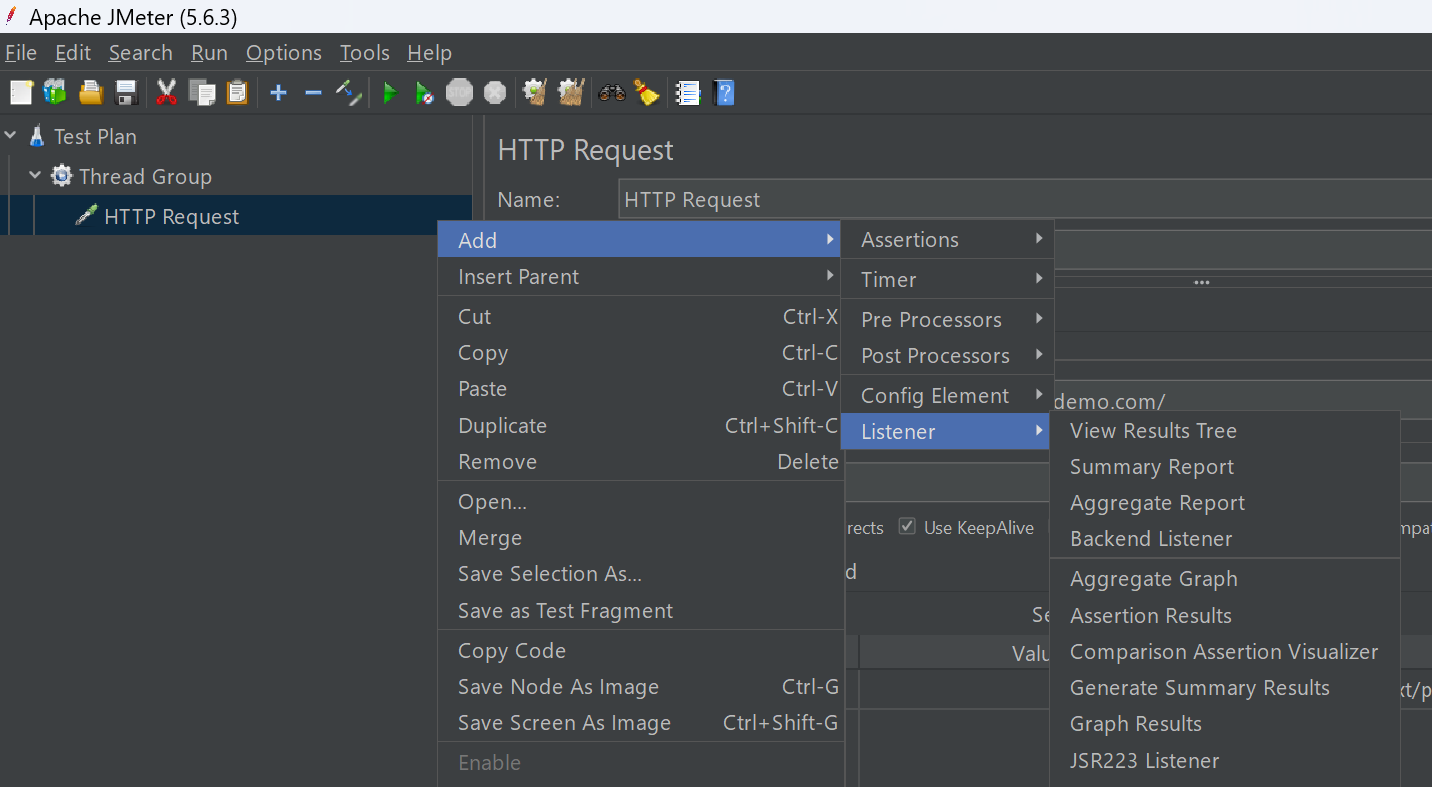
4. Include Listeners:
Listeners collect and display test results in various formats, like graphs or tables. They help you analyze performance data both during and after the test execution.
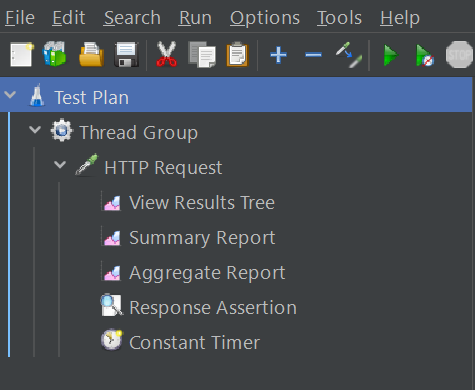
- Right click on the HTTP Request > Click Add > Listener
- Here, add three listeners, i.e., View Results Tree, Summary Report, and Aggregate Report
5. Configure Timers and Assertions:
Timers add realistic delays between requests to mimic real user behavior. Assertions validate server responses to ensure they meet expected results under load.
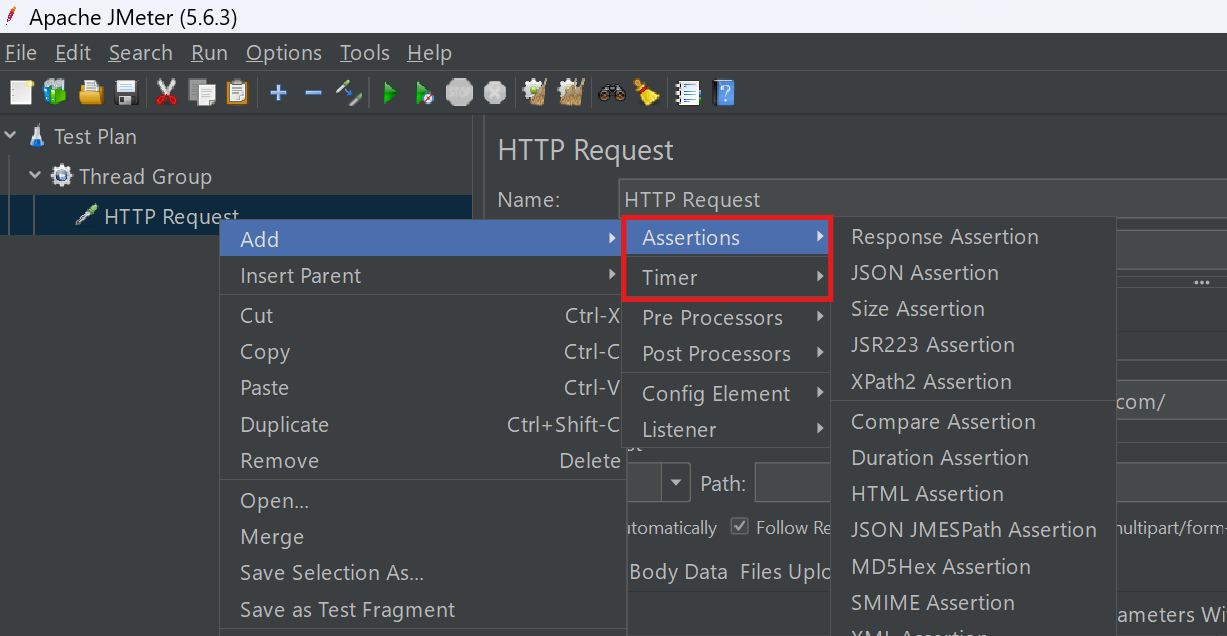
- For Assertions: Right click on the HTTP Request > Click Add > Assertions
- Add Response Assertion. Configure it to check for expected text, codes, or patterns in the response
- For Timer, right click on the HTTP Request > Click Add > Timer
- For this tutorial, Constant Timer will be added and default values will be kept, i.e., Thread Delay: 300 milliseconds
6. Save the Test Plan:
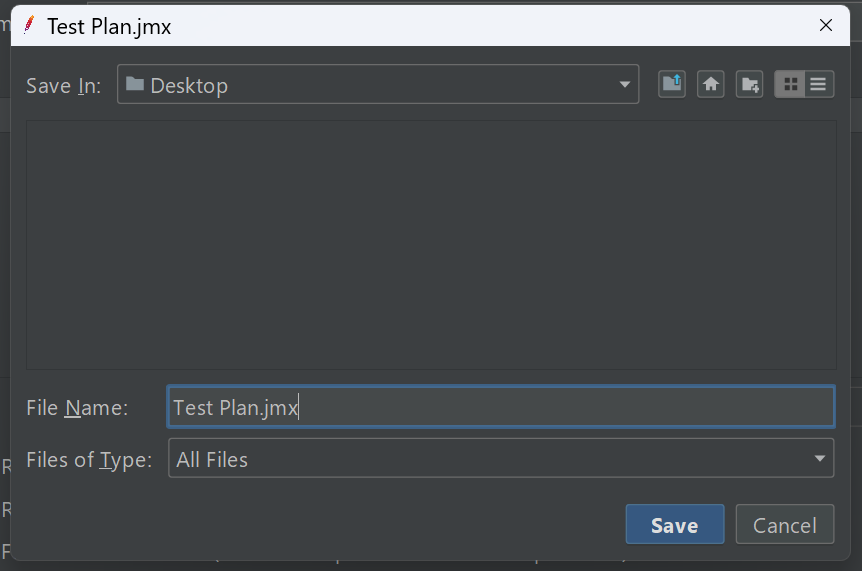
Once your test plan is complete, save it as a .jmx file. This file can be reused and shared with teammates.
Steps for JMeter Stress Testing
Once you have created a test plan, you can now perform stress testing using JMeter by following these steps:
1. Load the Test Plan:
Load the .jmx file you have previously saved (if not already loaded)
- Click on File > Open and select the .jmx file
2. Run the Test:
Execute the test and monitor how your application performs under load conditions.
- Click the green Start button on the toolbar (or press Ctrl + R on Windows or Command + R on Mac) to begin executing the test.
- To stop the test manually, click the red Stop button on the toolbar (or press Ctrl + .(period) on Windows or Command + .(period) on Mac)
3. Monitor the Test:
During the test, use listeners like View Results Tree, Summary Report, or Aggregate Report to observe the test execution and collect performance data
Read More: How to write a good Test Summary Report?
Analyzing JMeter Stress Testing Results
Once the stress test is complete, it’s important to carefully analyze the collected data to assess system performance under load.
Focus on key metrics like response time, error rate, throughput, and resource usage to identify any issues.
- High response times or increased error rates may indicate performance issues.
- Throughput can reveal how well the system handles heavy traffic.
- Resource usage, such as CPU and memory, shows if the system is stressed.
Analyzing these metrics helps pinpoint areas for improvement and ensure the system can handle expected user loads efficiently.
Read More: Understanding Test Closure Report
Utilizing Listeners for Data Analysis in JMeter
Listeners in JMeter are essential components that capture and present test results. They provide different formats such as tables, graphs, trees, and logs. That makes it easier to understand performance data.
Common listeners include Summary Report, View Results Tree, and Aggregate Report. These tools help track important metrics like response time, error rate, and throughput.
By reviewing this data, you can identify performance trends and spot potential issues during or after the test. Proper use of listeners ensures you gain accurate insights into how your system behaves under stress.
Best Practices for Stress Testing with JMeter
To ensure accurate and meaningful results, it’s important to follow certain best practices when performing stress testing with JMeter, like:
- Define Clear Objectives: Without a defined goal, stress tests can return meaningless results. It’s important to understand what you want to achieve, whether it’s identifying system limits or checking for performance degradation. Always have clear goals for the stress test, such as identifying system limits or measuring performance under load.
- Use Realistic Test Data: Test scenarios should reflect real-world usage patterns to provide accurate results. Using unrealistic or inconsistent data can lead to misleading conclusions about system performance. Simulate real-world usage by using realistic data to ensure accurate results.
- Gradually Increase Load: Start with a small load and gradually increase it to observe how the system behaves under varying stress levels.
- Monitor System Resources: Keep an eye on server resources like CPU, memory, and network usage to identify any performance issues.
- Use Distributed Testing: For large-scale tests, consider using multiple machines to distribute the load and simulate a more realistic environment.
- Plan for Error Handling: Ignoring errors or failed requests during stress testing can lead to inaccurate results. It’s essential to track and analyze all failures to ensure the system is resilient under load. Therefore, ensure your test includes checks for failed requests and errors to assess the system’s fault tolerance.
- Use Timers for Realism: Implement timers to simulate real user behavior by adding delays between requests.
- Perform Regular Test Runs: Run tests regularly to spot performance degradation over time and track improvements or issues.
- Testing in production environments: Conducting stress tests on live systems can disrupt normal operations and affect real users. Always use staging or test environments to avoid unintended service interruptions.
- Do not ignore baseline performance: Not establishing a baseline before stress testing makes it difficult to compare performance and identify issues. A baseline provides a reference point for understanding how the system performs under stress.
- System monitoring: Failing to monitor key system resources like CPU, memory, and network usage can result in undetected performance bottlenecks. Effective monitoring helps pinpoint the root causes of issues during stress tests.
- Ensure proper cleanup: Always see to it that proper cleanup is facilitated to maintain the integrity and reliability of future tests. Do not leave test data, sessions, or configurations without a cleanup after a stress test, as it can interfere with future tests.
Should You Use BrowserStack Performance Testing Instead?
JMeter stress testing requires setting up distributed infrastructure, managing test plan configurations, and manually correlating performance data from multiple sources. Teams spend significant time on infrastructure provisioning and JMeter-specific scripting before they can begin validating application behavior under stress.
BrowserStack Load Testing offers a different approach by eliminating infrastructure setup and enabling teams to run stress tests using their existing test scripts. The decision depends on whether your team prioritizes JMeter’s extensive protocol support or values infrastructure-free execution with faster time to results.
When BrowserStack is a better choice than JMeter:
- You want to avoid infrastructure management: BrowserStack runs stress tests on managed cloud infrastructure without requiring distributed JMeter setup, load generator provisioning, or ongoing maintenance.
- Your team uses existing functional tests: If you already have browser or API test scripts, BrowserStack lets you run stress tests from that code without creating separate JMeter test plans or learning XML configuration.
- You need unified frontend-backend visibility: BrowserStack provides frontend page load times and backend API metrics in one dashboard, eliminating manual correlation between JMeter results and separate monitoring tools.
- Speed matters more than protocol flexibility: BrowserStack enables immediate stress test execution without JMeter’s configuration overhead, though JMeter supports more protocols like JDBC, LDAP, and SMTP.
- You prioritize CI/CD integration simplicity: BrowserStack integrates directly with pipelines using minimal setup, while JMeter requires custom orchestration scripts for automated stress testing.
When JMeter remains the better option:
- You need protocol-specific testing beyond HTTP/HTTPS (database protocols, messaging systems, custom protocols)
- Your team already has extensive JMeter expertise and established test plans
- You require complete control over test execution logic and advanced scripting capabilities
Conclusion
Stress testing is essential for evaluating how a system performs under extreme load conditions. Using JMeter, especially in combination with platforms like BlazeMeter, enables you to simulate realistic traffic and gather valuable performance data.
By following best practices and analyzing key metrics, you can identify potential issues before they affect users. A well-executed stress test ensures your application remains stable, reliable, and ready to handle peak demand. Additionally, integrating real device testing platforms like BrowserStack lets you verify performance on 3500+ real devices and browsers. This ensures your application delivers a consistent user experience across different devices.

