Load testing in SoapUI helps assess how web services and APIs perform under varying levels of demand. It enables teams to identify performance bottlenecks and ensure reliable operation under real-world traffic conditions.
Overview
What is Load Testing in SoapUI?
Load testing in SoapUI is the process of simulating multiple concurrent requests to a web service or API to evaluate its behavior, stability, and responsiveness under different loads. It helps verify whether services can handle expected and peak traffic efficiently.
Why Run Load Tests in SoapUI?
- Ensure Service Reliability: Detect performance issues before they impact users.
- Validate Scalability: Confirm that APIs can handle growing numbers of requests.
- Identify Bottlenecks: Pinpoint slow endpoints, resource constraints, or configuration issues.
- Optimize Performance: Use insights to improve response times and server efficiency.
Key Concepts of Load Testing in SoapUI
- Threads: Represent simultaneous users or requests sent to the service during the test.
- Load Strategies: Define how requests are distributed over time, such as steady, ramp-up, or sudden bursts.
- LoadTest Assertions: Set performance criteria, such as maximum acceptable response time, to validate results against expectations.
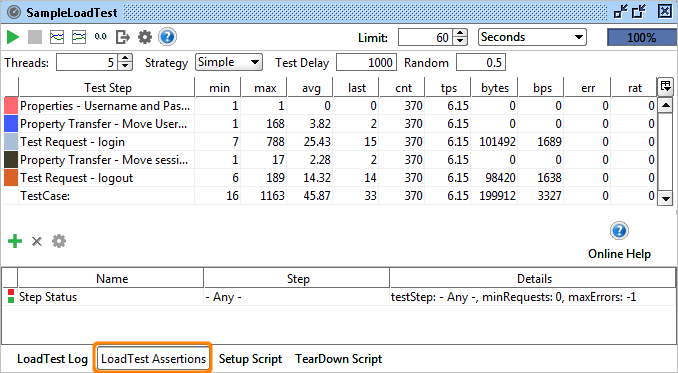
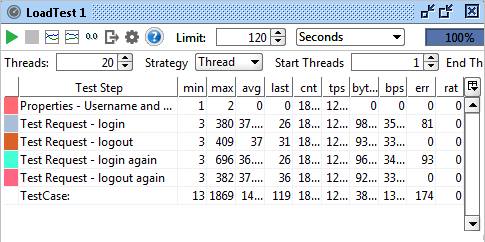
- Statistics Table: Displays ongoing and summary metrics, including response times, throughput, and error rates, for analysis during and after the test.
Steps to Perform Load Testing in SoapUI
- Create or open a functional test case for the target API or web service.
- Add a LoadTest to the test case.
- Configure Threads to simulate concurrent requests.
- Select a Load Strategy appropriate for your test scenario.
- Define Assertions to validate performance targets.
- Run the LoadTest and monitor results via the Statistics Table.
This article covers how to perform load testing in SoapUI, key concepts to understand, and practical steps to simulate real-world API traffic efficiently.
What is SoapUI Testing?
SoapUI is an open-source tool for testing APIs that follow SOAP or REST protocols. It supports both basic and advanced testing and is commonly used in projects that involve web services. Its interface allows testers to create, manage, and run requests with minimal setup.
While SoapUI is mainly used for functional testing, it also supports performance testing by allowing test cases to simulate multiple users. This helps evaluate how the system holds up under heavy load and reveals potential slowdowns or failures.
For example, if an API processes customer orders, SoapUI can simulate hundreds of users placing orders simultaneously. This makes it easier to find performance issues early in development.
Read More: What is API Testing? (with Examples)
Getting Started With SoapUI Load Testing
To create a load test in SoapUI, start by setting up a SOAP project, adding a test suite, and converting the test case into a load test. You can then configure threads, delays, and load strategies to simulate traffic and monitor how the service responds.
Follow the steps below to create a complete load test setup:
1. Create a New SOAP Project and Test Suite
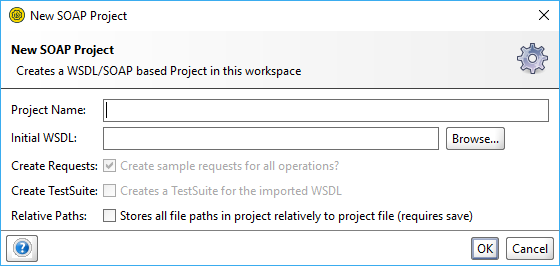
Start by opening SoapUI on the desktop and navigating to File > New SOAP Project.
In the dialog box, enter a project name and the WSDL URL. Check the boxes for Create Requests and Create TestSuite to automatically generate sample requests and test cases.
Then, click OK to create the project.
2. Generate the SoapUI Load Testing Suite
Once the functional tests are in place, right-click any test case and choose New LoadTest. SoapUI creates a LoadTest based on that test case, preserving its request and response structure. You can repeat this for each test case to build multiple load tests.
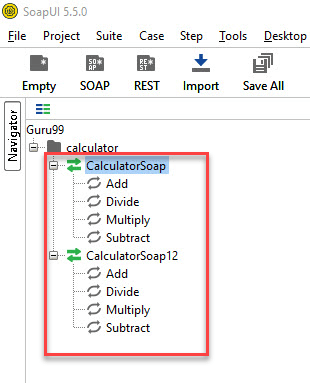
In the project panel, you’ll see a structure like CalculatorSoapTestSuite, containing both the test cases and their associated load tests. Each LoadTest will initially mirror its functional test, but can be customized separately.
3. Add an Assertion to the Load Test
Assertions in SoapUI help verify whether a service performs as expected during a load test. They check things like response time, status codes, or message content.
To add an assertion:
- Open the LoadTest editor and go to the Assertions tab.
- Click the Add Assertion (+) button on the menu bar.
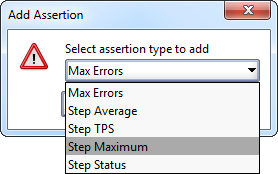
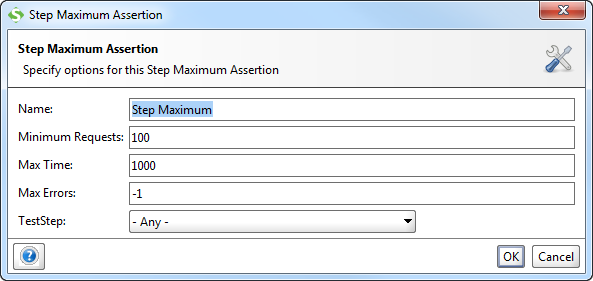
- In the dialog box, select Step Maximum as the assertion type. The most common choice for performance testing is the “Step Maximum” assertion, which allows the tester to set a maximum allowed response time (in milliseconds).
- In the next window, set the Max Time (default is 1000 milliseconds) and click OK. The test step will fail if the service takes longer than this limit.
- The assertion has now been added to the LoadTest.
Read More: What is Assertion Testing?
4. Create and Run the SoapUI Load Test
Once the LoadTest is set up and assertions are in place, the test can be executed to observe how the service performs under load.
To run the test:
- Go to the LoadTest tab.
- Adjust the key settings as needed:
- Threads: Number of virtual users running the test.
- Test Delay: The wait time (in milliseconds) between each thread’s execution.
- Limit Type: Whether the test should stop after a set number of runs or a specific time duration.
- Load Strategy: The pattern of how the load is applied (e.g., Simple, Fixed Rate, Variable Load).
- Click the Start button (green play icon) at the top left of the LoadTest window. As the test runs, real-time metrics will be displayed in the graph and log panel below, such as:
- Minimum and maximum response time
- Average response time
- Transactions per second (TPS)
- Error count
Different Load Strategies in SoapUI
SoapUI supports multiple load strategies to control how virtual users are applied during a test. Each strategy simulates a different traffic pattern to help assess how an API performs under changing conditions.
Here are the main strategies available:
1. Simple Strategy
This is the default load strategy when a LoadTest is created. It runs a fixed number of threads with a defined delay between each execution. Every thread sends requests at regular intervals, creating a predictable and controlled traffic pattern.
Best for: Quick functional validation or observing basic performance behavior with minimal stress.
For example, if you configure 10 threads with a 10,000 ms delay, SoapUI will run 10 virtual users and wait 10 seconds between each thread’s execution. This spreads out the requests and mimics steady usage from a small user base.
2. Fixed Rate Strategy
This strategy ensures a consistent number of executions per second, regardless of how long each request takes to complete. SoapUI dynamically manages threads to meet the target rate and may launch additional threads if the system falls behind.
Best for: stress testing or maintaining a constant traffic load over time.
For example, if you set a fixed rate of 10 executions per second and one test step takes 300 ms to finish, SoapUI may start more threads in parallel to ensure that 10 requests are launched every second. To avoid overloading, you can define a Max Threads limit, which caps the number of concurrent threads at a safe level.
3. Variable Load Strategies
Variable strategies are helpful when testing how your API handles changing traffic patterns, such as gradual increases, short bursts, or periodic fluctuations.
Below are the key strategies used to implement variable load patterns in SoapUI:
- Variance Strategy: Changes the thread count in a wave pattern, gradually increasing and decreasing load during the test. For example, if the base is 20 and the variance is 0.8, the thread count rises to 36, then drops to 4, and repeats this cycle every 60 seconds.
- Burst Strategy: Stays idle for a set time and then runs a sudden burst of traffic to simulate short spikes. For example, it waits 10 seconds, runs 20 threads for 10 seconds, and then goes idle again.
- Thread Strategy: Increases the thread count steadily from a low value to a high value throughout the test duration. For example, starts at 5 threads and grows to 50 over 1,350 seconds.
- Grid Strategy: Uses exact thread counts at fixed time blocks to simulate a custom load pattern. For example, runs 10 threads for 10 seconds, then 20 threads for 10 seconds, then back to 10, then jumps to 40.
- Script Strategy: Uses a custom Groovy script to change thread count dynamically during the test. For example, the script sets a random thread count between 5 and 15 at each interval.
Interpreting Test Results When Load Changes During Execution
As the load test runs, SoapUI displays real-time metrics that help track how the system responds to changing traffic. When thread count increases or load strategies shift mid-test, these changes directly affect system behavior. Watching key metrics helps detect slowdowns, failures, or signs of overload.
Here are the main metrics to monitor:
- Min and Max Response Time: Show the fastest and slowest responses. A rising maximum may suggest performance degradation at higher loads.
Also Read: Response Time Testing in Software Testing
- Average Response Time: Gives the overall speed of the service. A steady rise may indicate the system is slower as load increases.
- Transactions Per Second (TPS): Shows how many requests are completed every second. A drop in TPS often means the system is struggling to keep up.
- Error Count: Tracks failed requests due to timeouts, server errors, or assertion failures. Spikes in this count point to stability issues under load.
By observing how these values shift as load changes, testers can spot bottlenecks, find limits, and identify areas of performance breakdown.
Read More: Performance Testing Vs Load testing
Limitations of SoapUI Load Testing
SoapUI works well for basic load testing but falls short when handling complex or large-scale scenarios.
Here are some of the key limitations to be aware of:
- No Built-in Server Monitoring: SoapUI focuses on client-side test execution. It does not provide visibility into server performance metrics like CPU usage, memory, or disk I/O during a test.
Also Read: Understanding the Basics of Web Performance
- No Browser-Level Simulation: SoapUI tests APIs directly and does not simulate real browsers. This means frontend rendering performance or JavaScript-heavy applications cannot be tested using SoapUI alone.
- Thread Limitations: SoapUI may struggle to run high thread counts effectively on lower-end machines. Performance can degrade when simulating too many users from a single local setup.
- High Memory Consumption: Running extensive tests can consume a significant amount of RAM, especially when multiple threads and requests are active.
- Limited Support for Dynamic Test Flows: Unlike advanced tools that support custom scripting and conditional flows, SoapUI’s load test logic is relatively basic.
- Lacks In-Depth Test Reports: While it provides real-time charts and basic logs, SoapUI does not offer advanced reporting dashboards, historical comparisons, or visual summaries of test outcomes.
Perform Load Testing in Real-World Scenarios With BrowserStack
SoapUI focuses primarily on API functional testing with basic load testing capabilities, but lacks comprehensive visibility into how API performance affects overall application behavior under stress. Testing APIs in isolation misses critical issues that emerge when frontend and backend systems interact under concurrent user load.
BrowserStack Load Testing enables teams to validate application performance under realistic conditions by simulating both browser traffic and API requests simultaneously. This approach reveals how systems behave when real users generate load across the entire application stack.
Key advantages for real-world load testing:
- Simulate complete user journeys: Test both browser interactions and API calls together to understand how frontend performance degrades when backend services face concurrent requests, not just isolated API response times.
- Generate traffic from multiple geographies: Simulate up to 1,000 virtual users from different global locations to test how applications handle distributed load patterns that match actual user distribution.
- Unified frontend and backend metrics: Correlate API response durations with page load times and error rates in one dashboard to identify whether performance issues stem from API latency or frontend processing.
- Use existing test scripts: Run load tests from current functional test code without creating separate SoapUI test projects or learning XML-based configuration formats.
- Zero infrastructure setup: Execute realistic load scenarios on managed cloud infrastructure without provisioning servers or maintaining distributed testing environments.
Conclusion
Load testing helps teams understand how their APIs and services behave under pressure. SoapUI makes it easy to turn functional tests into load tests and apply different traffic patterns using built-in strategies. It is a solid starting point for small-scale or local testing, especially when testing SOAP or REST APIs.
For more realistic and scalable scenarios, BrowserStack helps test performance across browsers, devices, and global locations. It supports open-source tools, provides advanced metrics, and runs extensive tests from the cloud. This allows teams to go beyond local limitations and get a complete view of how their applications perform for real users.

