JMeter command line execution allows testers to run performance tests without using the GUI, which helps save system resources and makes automation easier. It is especially useful for running large-scale or continuous load tests in CI/CD pipelines.
Overview
What is JMeter Command Line Execution?
JMeter command line execution enables testers to run performance tests without relying on the graphical interface. This approach helps conserve system resources, ensures faster test runs, and integrates smoothly into automated CI/CD pipelines.
Basic Command Structure of JMeter Command Line Execution
The basic syntax to run a JMeter test from the command line is:
jmeter -n -t <test_plan.jmx> -l <results_file.jtl> [options]
Explanation of flags:
- -n: Runs JMeter in non-GUI (command line) mode.
- -t <test_plan.jmx>: Specifies the path to your JMeter test plan file.
- -l <results_file.jtl>: Specifies the path to save the test results.
- [options]: Additional optional flags like -J for properties, -D for system properties, or -H/-? for help.
Steps to Execute JMeter from the Command Line
1. Navigate to the JMeter bin directory: Open a terminal or command prompt and go to the bin folder within your JMeter installation.
2. Run the command: Execute JMeter using the appropriate command format, replacing placeholders with your actual test plan and paths.
- Windows: Use jmeter.bat or jmeterw.cmd (the latter runs without a console window).
- Linux/macOS: Use sh jmeter to start the test.
This article covers how to execute JMeter tests from the command line, different methods to trigger test runs, and advanced ways to automate performance testing workflows.
3 Modes to Launch the Apache JMeter
Apache JMeter can be launched in three different modes, depending on your testing needs and environment:
- GUI Mode: This is the default mode, where JMeter opens with a graphical user interface. It is useful for creating, editing, and debugging test plans. However, due to the overhead of the graphical interface, it is not recommended for running large-scale or resource-intensive tests.
- Command Line Mode (Non-GUI Mode): In this mode, JMeter runs from the terminal or command prompt without a graphical interface. It is more efficient for running tests, especially for performance testing or automated testing with large loads, as it reduces system resource consumption.
Read More: Performance Testing vs Load Testing
- Server Mode (Non-GUI Mode): Server mode is used for distributed testing. Here, one machine acts as the master (client) and others act as slaves (remote servers) to simulate a higher number of virtual users. It helps scale tests across multiple machines, allowing for more extensive load testing.
Why Use JMeter in Command Line (Non-GUI) Mode?
Running JMeter in non-GUI mode offers several benefits that make it ideal for performance testing in real-world environments:
- Improved Performance: Non-GUI mode consumes fewer system resources than GUI mode, allowing for more efficient execution of large or complex test plans while conserving system resources.
- Accurate Test Results: JMeter command line execution ensures more accurate and reliable test results, especially under high load, by eliminating the graphical interface overhead.
- Automation Friendly: Non-GUI mode integrates easily into CI/CD pipelines or test scripts, enabling continuous testing and streamlining the testing workflow.
- Suitable for Remote Execution: JMeter tests can be run on remote servers or headless environments where the GUI is unavailable. This is useful for distributed testing and executing tests on server-based setups.
- Scalability: Command-line mode supports distributed testing, enabling multiple machines to contribute to test execution. This is essential for simulating a large number of users and expanding test setups as needed.
How to Invoke a JMeter Test from the Command Line
Running a JMeter test from the command line is a quick and efficient way to execute test plans without launching the graphical user interface. This is especially useful for automation, headless environments, or running tests as part of a CI/CD pipeline.
Here are the steps for JMeter command line execution:
- Ensure Apache JMeter and Java are installed on your system.
- Ensure that the environment variable PATH is set for both JMeter and Java.
- Open CMD (on Windows) or Terminal (on Mac) and enter the following command:
For Windows:
jmeter -n -t "C:\path\to\testplan.jmx" -l "C:\path\to\results.jtl" -e -o "C:\path\to\output-folder"
For Mac:
jmeter -n -t /Users/yourname/path/to/testplan.jmx -l /Users/yourname/path/to/results.jtl -e -o /Users/yourname/path/to/output-folder
This command runs the test plan and saves the raw results, which can later be used to generate reports or analyze performance metrics. An HTML report is also generated automatically in the specified output folder.
Output:
This output confirms that the test was executed successfully and shows performance metrics such as average response time, error rate, and requests per second. The results can be reviewed in the .jtl file or through the generated HTML report.
Read More: What is Test Evaluation Report
Explanation of command-line flags :
- -n (Non-GUI mode): This flag runs JMeter without opening the graphical interface. It is mandatory for command-line execution and helps save system resources.
- -t (Test Plan): Specifies the path to the .jmx test plan file that you want to execute. Make sure the file exists and is correctly configured.
- -l (Log file): Defines the path where test results should be saved in .jtl format. This file contains raw data that can be used for later analysis or report generation.
- -e (Generate report): Instructs JMeter to automatically create an HTML report after the test run is complete. It processes the .jtl file and summarizes the results.
- -o (Output folder): Sets the directory where the HTML report will be stored. The folder must be empty or not already exist before the test starts.
Advanced Methods for JMeter Command Line Execution
Server (Non-GUI) mode in Apache JMeter enables performance testing at scale by distributing test execution across multiple machines. This allows you to simulate high loads efficiently. Below are three advanced methods for JMeter command line execution that work well in non-GUI mode and are suitable for CI/CD and large-scale testing environments.
1. Execute JMeter Tests with Apache Ant
Apache Ant is a Java-based build tool for automating tasks such as compiling code, packaging files, and running test scripts. It can also trigger JMeter test plans in a structured and repeatable way.
Here are step-by-step instructions to use Apache Ant to execute JMeter tests:
1. Install Apache Ant on your System
Download Ant from the official site. Unzip the package and set the environment variables:
- For Windows:
set ANT_HOME=C:\path\to\apache-ant

set PATH=%ANT_HOME%\bin;%PATH%
- For Mac:
export ANT_HOME=/path/to/apache-ant

export PATH=$ANT_HOME/bin:$PATH
- Verify the installation by running:
ant -version
This will return the Ant version number.
2. Create a JMeter Test Plan
Save your .jmx test plan (e.g., testplan.jmx) in the working directory. If you’re new to JMeter test plans, they can be created using the JMeter GUI or manually by writing the XML configuration.
Read More: What to include in a Regression Test Plan?
3. Set Up Ant Build File
Create a file named build.xml in the same directory with the following content:
<project name="JMeterTest" default="run" basedir=".">

    <property name="jmeter.home" location="/path/to/jmeter" />

    <property name="test.plan" location="testplan.jmx" />

    <property name="result.file" location="results.jtl" />


    <target name="run">

        <exec executable="${jmeter.home}/bin/jmeter">

            <arg value="-n"/>

            <arg value="-t"/>

            <arg value="${test.plan}"/>

            <arg value="-l"/>

            <arg value="${result.file}"/>

        </exec>

    </target>

</project>
Replace /path/to/jmeter with your actual JMeter installation path.
Explanation of the Ant Build File:
- <property name=”jmeter.home” location=”/path/to/jmeter” />: Defines the path to your JMeter installation. This is a placeholder to keep paths organized.
- <property name=”test.plan” location=”testplan.jmx” />: Points to the .jmx test plan file to be executed.
- <property name=”result.file” location=”results.jtl” />: Specifies the location where the results will be stored in a .jtl file.
- <exec executable=”${jmeter.home}/bin/jmeter”>: Executes the JMeter command. The command inside <exec> will run JMeter in non-GUI mode.
- <arg value=”-n”/>: Runs JMeter in Non-GUI mode.
- <arg value=”-t”/>: Specifies the path to the .jmx file to be executed.
- <arg value=”-l”/>: Tells JMeter to save the results in a file.
4. Run the Test Using Ant
In the terminal or command prompt, run:
ant
This will execute the test in non-GUI mode using the .jmx file and generate results in a .jtl file.
5. Expected Output
Terminal output will show something like:
6. Common Issues
Here are common issues you might encounter while executing the test, along with tips for troubleshooting:
- Java or Ant Not Found: If Ant or Java is not found, double-check that the environment variables (ANT_HOME and JAVA_HOME) are set correctly and that their paths are included in your PATH.
- File Path Issues: Make sure the paths to the JMeter binary and .jmx test plan are correct in the build.xml file. If your test plan file is in a different directory, adjust the <property name=”test.plan” location=”testplan.jmx” /> line to point to the correct path.
- Out-of-Memory Issues: JMeter tests can consume a lot of memory, especially when simulating many users. If you encounter out-of-memory errors, you can increase the heap size by editing the jmeter.bat (Windows) or jmeter.sh (Mac/Linux) file in the bin/ folder and adjusting the HEAP variable.
2. Use Apache Maven to Execute JMeter Tests
Apache Maven is a powerful build automation tool used primarily for Java projects. With the help of the JMeter Maven Plugin, you can easily run JMeter tests as part of your build lifecycle, which makes it useful for automation and integration in CI/CD pipelines.
Read More: How to Create Maven Project in Eclipse
Here are step-by-step instructions to use Apache Maven to execute JMeter tests:
1. Install Apache Maven
Download Maven from the official site. Unzip the archive and set up the environment variables.
- For Windows:
set MAVEN_HOME=C:\path\to\apache-maven

Set PATH=%MAVEN_HOME%\bin;%PATH%
- For Mac:
export MAVEN_HOME=/path/to/apache-maven

export PATH=$MAVEN_HOME/bin:$PATH
Verify the installation by running:
mvn -version
This will return the version number.
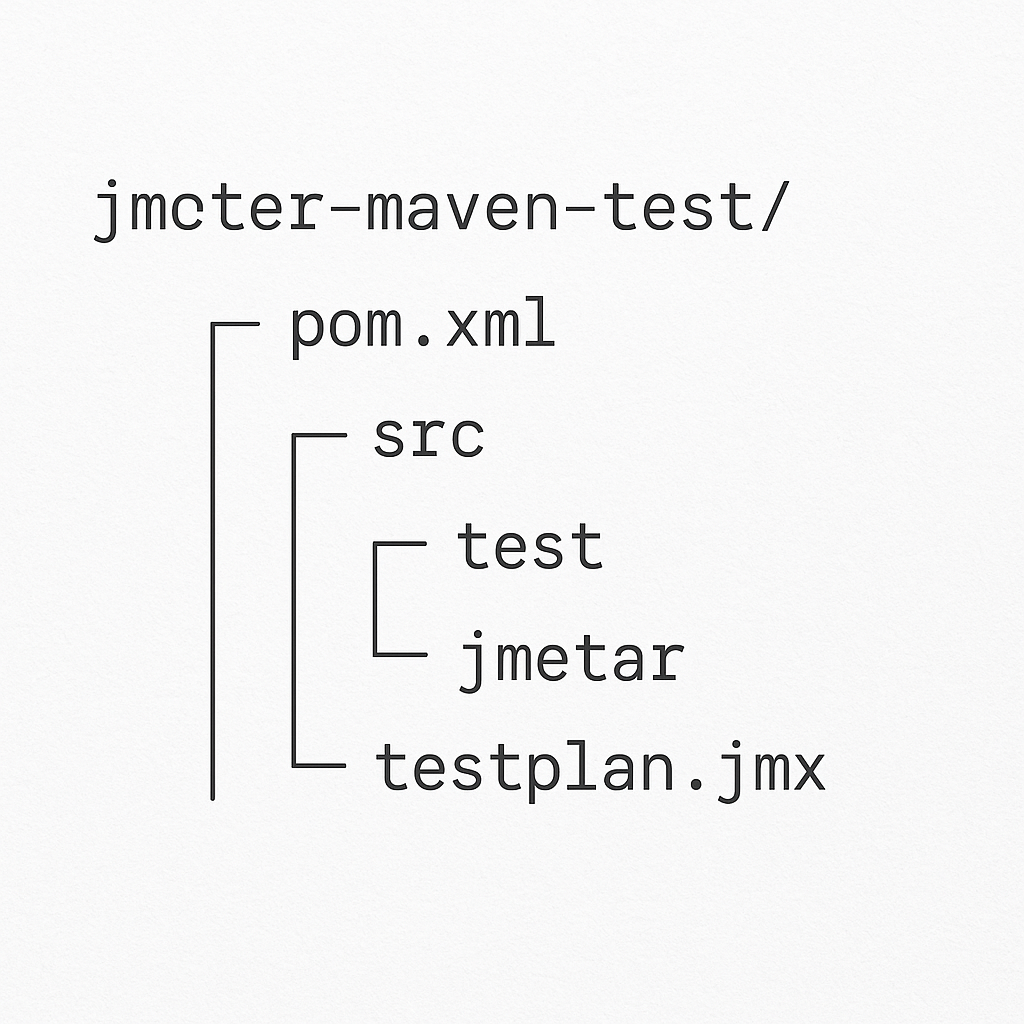
2. Create a Maven Project Folder Structure with JMeter Plugin
Create a folder for your Maven project (e.g., jmeter-maven-test), and navigate to it. This folder will hold the necessary project structure.
The structure should look like this:
- pom.xml: Maven configuration file.
- src/test/jmeter/testplan.jmx: JMeter test plan file.
Place your .jmx test plan (e.g., testplan.jmx) under the src/test/jmeter/ directory. For this tutorial, the .jmx file name is testplan.jmx
3. Configure the Maven pom.xml File
Create and edit the pom.xml file and paste the following code:
<project xmlns="http://maven.apache.org/POM/4.0.0"

         xmlns:xsi="http://www.w3.org/2001/XMLSchema-instance"

         xsi:schemaLocation="http://maven.apache.org/POM/4.0.0

                             http://maven.apache.org/xsd/maven-4.0.0.xsd">

    <modelVersion>4.0.0</modelVersion>


    <groupId>com.example</groupId>

    <artifactId>jmeter-test</artifactId>

    <version>1.0-SNAPSHOT</version>


    <build>

        <plugins>

            <plugin>

                <groupId>com.lazerycode.jmeter</groupId>

                <artifactId>jmeter-maven-plugin</artifactId>

                <version>3.4.0</version>

                <executions>

                    <!-- Step 1: Configure JMeter plugin -->

                    <execution>

                        <id>configuration</id>

                        <goals>

                            <goal>configure</goal>

                        </goals>

                    </execution>


                    <!-- Step 2: Run JMeter tests -->

                    <execution>

                        <id>jmeter-tests</id>

                        <goals>

                            <goal>jmeter</goal>

                        </goals>

                    </execution>

                </executions>

            </plugin>

        </plugins>

    </build>

</project>
This configuration ensures that Maven uses the JMeter Maven Plugin to run the JMeter tests.
- The <goal>configure</goal> goal prepares the environment.
- The <goal>jmeter</goal> goal executes the JMeter test plan.
Also Read: What is POM in Maven
4. Run the Test Using Maven
In your terminal, navigate to the project directory and execute the following command:
mvn verify
This command compiles the project and runs your JMeter test plan using the plugin.
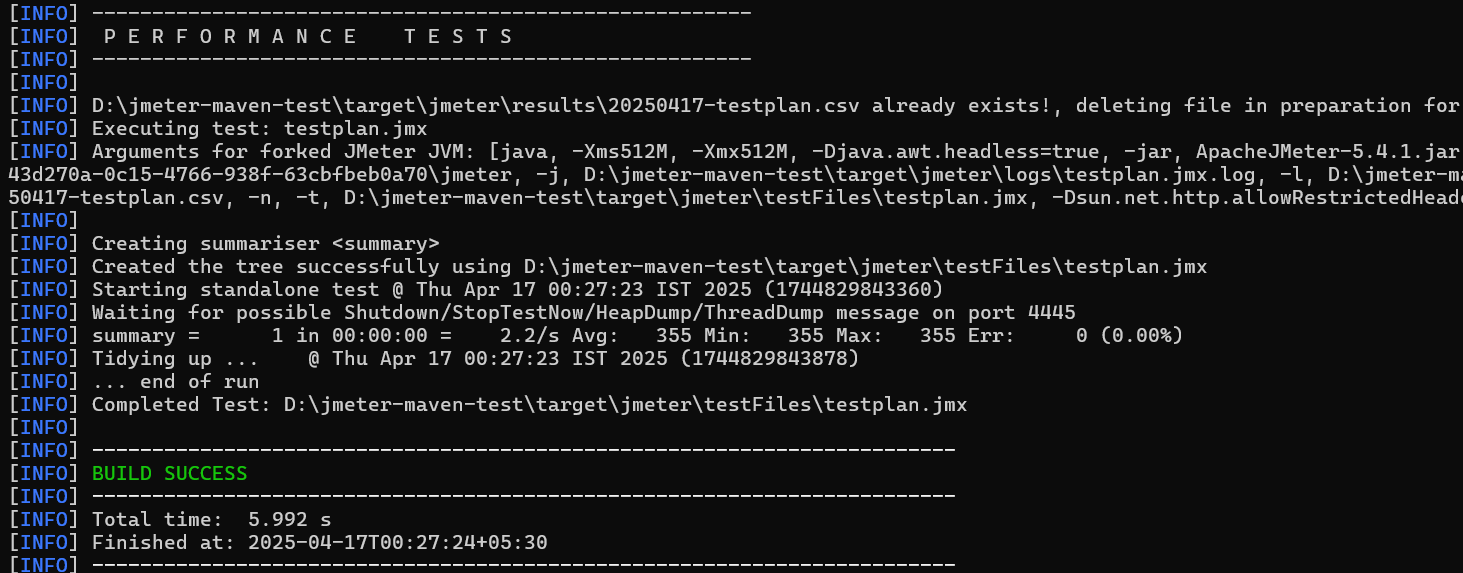
After the command runs, Maven generates test results and saves them in the target/jmeter/ directory. This will include the result files in formats such as .jtl and the generated reports.
The reports and results, including information such as throughput, response time, and errors, will be in the target/jmeter/directory. Here’s how the output will look.
3. Run a JMeter Test from Java Code
You can also run JMeter test plans programmatically using Java code. This is useful if you want to integrate performance tests into a custom framework, run dynamic test plans, or trigger tests from within other applications.
Here are the steps to run a JMeter test from Java code:
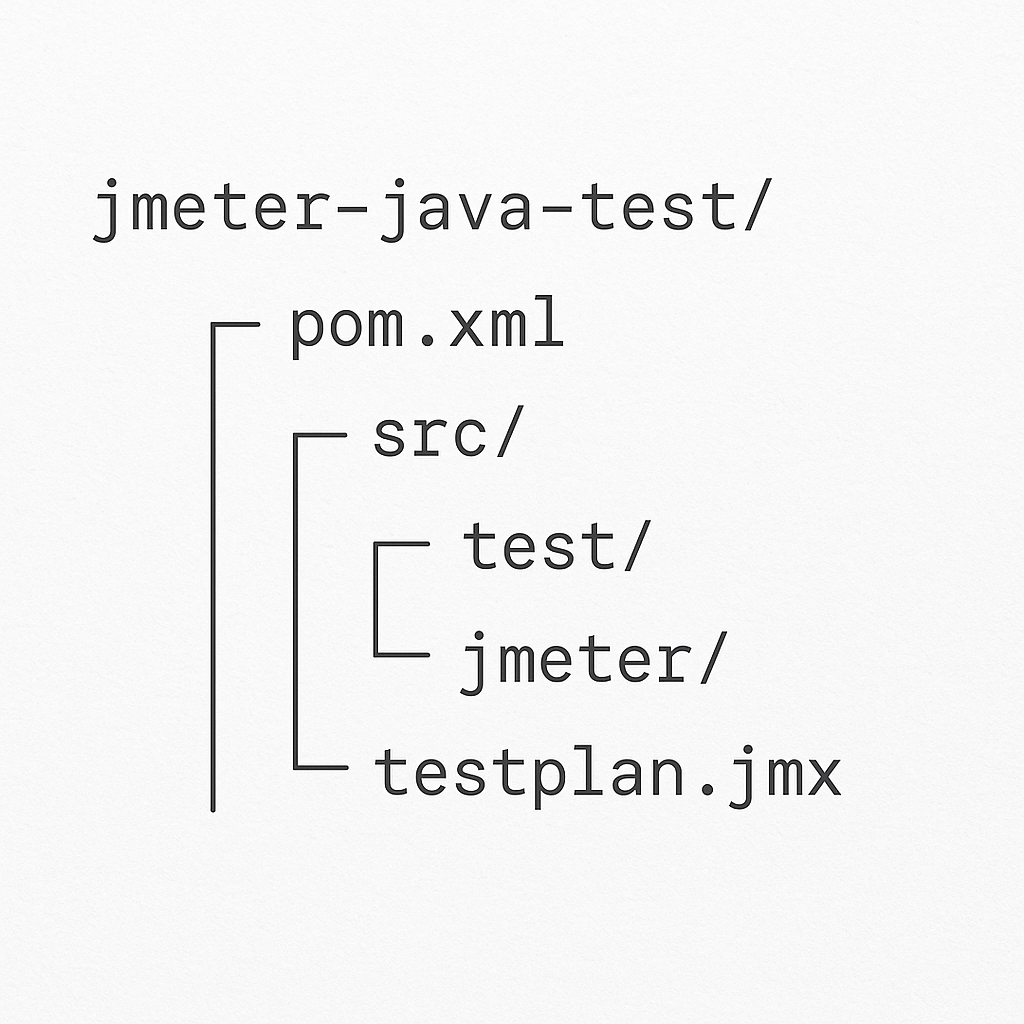
1. Create Folder Structure
To begin running a JMeter test from Java code, you first need to set up a proper project structure. This ensures that JMeter dependencies and your test plans are neatly organized, making it easier to maintain and run tests programmatically.
Here’s how the folder structure should look:
2. Create and Save the pom.xml File:
Create a file named pom.xml in the root directory (jmeter-java-test/). Open it in a text editor and paste the following Maven configuration:
<project xmlns="http://maven.apache.org/POM/4.0.0"

         xmlns:xsi="http://www.w3.org/2001/XMLSchema-instance"

         xsi:schemaLocation="http://maven.apache.org/POM/4.0.0

         http://maven.apache.org/xsd/maven-4.0.0.xsd">


    <modelVersion>4.0.0</modelVersion>


    <groupId>com.example</groupId>

    <artifactId>jmeter-java-test</artifactId>

    <version>1.0-SNAPSHOT</version>


    <dependencies>

        <dependency>

            <groupId>org.apache.jmeter</groupId>

            <artifactId>ApacheJMeter_core</artifactId>

            <version>5.6.3</version>

        </dependency>

        <dependency>

            <groupId>org.apache.jmeter</groupId>

            <artifactId>ApacheJMeter_components</artifactId>

            <version>5.6.3</version>

        </dependency>

        <dependency>

            <groupId>org.apache.jmeter</groupId>

            <artifactId>ApacheJMeter_functions</artifactId>

            <version>5.6.3</version>

        </dependency>

    </dependencies>


    <build>

        <plugins>

            <plugin>

                <groupId>org.codehaus.mojo</groupId>

                <artifactId>exec-maven-plugin</artifactId>

                <version>3.1.0</version>

                <configuration>

                    <mainClass>com.example.JMeterRunner</mainClass>

                </configuration>

            </plugin>

        </plugins>

    </build>

</project>
This configuration defines the necessary JMeter dependencies and sets up the exec-maven-plugin to run the JMeterRunner Java class.
Read More: What is Maven Dependency?
3. Create the Java Code (JMeterRunner.java):
Inside the src/main/java/com/example/ folder, create the file JMeterRunner.java and add the following code to run the JMeter test:
package com.example;


import org.apache.jmeter.engine.StandardJMeterEngine;

import org.apache.jmeter.save.SaveService;

import org.apache.jmeter.util.JMeterUtils;

import org.apache.jorphan.collections.HashTree;


import java.io.File;


public class JMeterRunner {

    public static void main(String[] args) {

        // Set JMeter home

        String jmeterHome = "<JMeter Path Here>";  // Update this path


        // Set JMeter properties and initialize

        JMeterUtils.setJMeterHome(jmeterHome);

        JMeterUtils.loadJMeterProperties(jmeterHome + "/bin/jmeter.properties");

        JMeterUtils.initLocale();


        // Load the JMeter test plan (JMX file)

        File jmxFile = new File("test/jmeter/testplan.jmx");  // Update path if needed

        try {

            HashTree testPlanTree = SaveService.loadTree(jmxFile);


            // Set up the engine to run the test plan

            StandardJMeterEngine jmeter = new StandardJMeterEngine();

            jmeter.configure(testPlanTree);

            jmeter.run();

        } catch (Exception e) {

            e.printStackTrace();

        }

    }

}
Update the jmeterHome path and testplan.jmx path according to your system.
4. Build and Run the Test Using Maven:
After creating the folder structure, pom.xml, and Java code, you can compile and run the test using Maven.
- Open a terminal or command prompt.
- Navigate to the root directory of your project (jmeter-java-test/).
- Run the following command to compile the project:
mvn compile
- Once the project is compiled, run the Java code with:
mvn exec:java
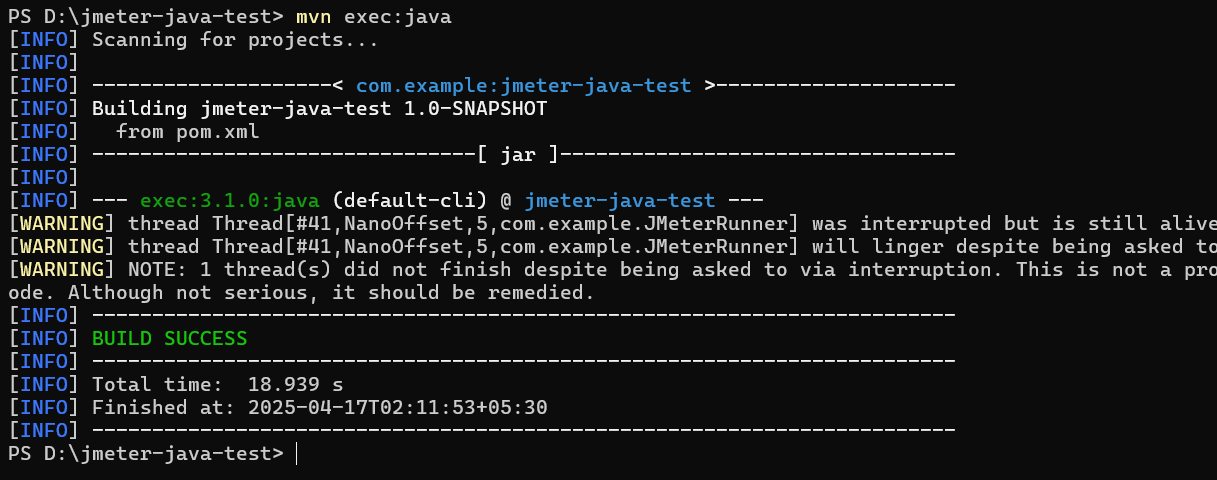
Maven will automatically download the dependencies (like JMeter libraries) and execute the JMeterRunner.java class to run the JMeter test plan (testplan.jmx).
After a successful run, the output in the terminal will indicate the success of the test execution. You should also see generated result files, such as .jtl files or any logs based on your test plan.
Why Run Load Tests with BrowserStack Performance Testing?
Load testing often requires significant infrastructure investment, complex setup processes, and specialized expertise to generate realistic traffic at scale. Teams spend valuable time provisioning servers, configuring distributed test environments, and maintaining testing infrastructure instead of focusing on identifying and resolving performance issues.
BrowserStack Load Testing eliminates these barriers by providing a cloud-based solution that enables teams to validate application performance without infrastructure overhead. Teams can start testing immediately using their existing test scripts and integrate performance validation directly into development workflows.
Key advantages of running load tests with BrowserStack:
- Zero infrastructure setup: Generate up to 1,000 concurrent virtual users from multiple geographic locations without provisioning servers, configuring load generators, or maintaining testing infrastructure.
- Use existing test scripts: Run both browser and API load tests directly from current functional test scripts without rewriting code or learning new frameworks, reducing time to the first test.
- Unified performance visibility: Correlate frontend page load times with backend API response durations and error rates in a single dashboard for faster root cause identification.
- Seamless CI/CD integration: Trigger automated load tests on every commit to catch performance regressions before production deployment, without separate manual testing phases.
- Real-time monitoring and debugging: Track performance metrics during test execution and access detailed logs, error traces, and network data to resolve bottlenecks instantly.
Conclusion
Running JMeter from the command line helps testers execute large-scale performance tests efficiently without the GUI overhead. It enables better automation, resource optimization, and integration with CI/CD pipelines. Advanced options such as Ant, Maven, and Java code provide flexibility for configuring and managing test execution.
BrowserStack’s performance testing platform complements this by enabling load tests on real browsers and devices in the cloud. It delivers accurate results that reflect real-world traffic and user conditions, helping teams validate both backend performance and end-user experience effectively.


