A load testing report provides a detailed overview of how an application or system performs under simulated user load. It helps teams identify performance bottlenecks, verify system stability, and make data-driven optimization decisions.
Overview
What is a Load Testing Report?
A load testing report is a structured document generated after executing a load test. It summarizes the behavior, performance metrics, and resource usage of the system under test, offering insights into both successes and potential issues.
Purpose of a Load Testing Report
- Evaluate System Performance: Understand how the application behaves under different levels of user load.
- Identify Bottlenecks: Pinpoint slow endpoints, errors, or infrastructure limitations.
- Support Decision-Making: Provide actionable data for capacity planning, scaling, and optimization.
- Validate SLAs: Confirm that performance meets business and technical expectations.
Key Components of a Load Testing Report
- Summary: Provides an overview of the test, including total duration, number of virtual users, and overall results.
- Key Performance Indicators (KPIs): Highlights essential metrics, such as total hits, transaction count, average/min/max response times, throughput, error percentage, and total data transferred.
- Transaction Analysis: Breaks down each transaction with success/failure counts and detailed response times.
- Server Statistics: Shows resource utilization, including CPU, memory, and network usage, to understand infrastructure impact.
- Graphical Representation: Visualizes performance over time using charts like response time vs. time, active threads vs. time, and throughput vs. time.
- Configuration Details: Lists test environment information, type of test (load, stress, endurance), start/end times, and number of load generators used.
- Error Analysis: Summarizes errors encountered during the test for troubleshooting and optimization.
This article covers the purpose, key components, and practical value of a load testing report, helping teams interpret results and optimize application performance.
What is a Load Testing Report?
A load testing report is a comprehensive document that details an application’s performance under varying load conditions. It includes key metrics such as average response time, error rate, throughput, requests per second, and concurrent users. Developers, QA teams, product teams, and stakeholders use it to assess the application’s performance during load testing.
Why are Load Testing Reports Important?
Load testing reports give insights about how the application performs under stress, identify bottlenecks, ensure reliability, and optimize performance. Below is the list of reasons why they are helpful.
- Identify Bottlenecks: Load testing reports underline errors, slow response times, and resource constraints (CPU, memory, database) under test.
- Ensure System Reliability: Load testing simulates real-world traffic. This report highlights the data on whether the application can handle loads without crashing or slowing down.
Read More: What is Reliability Software Testing
- Minimize Downtime: Load testing reports help identify critical failures before deployment. Catching these issues early reduces the risk of outages in production and avoids the cost associated with unplanned downtime.
- Support Informed Decision-Making: Reports provide clear performance data that guide teams in optimizing the system, planning resource allocation, and shaping future testing efforts based on actual results.
- Validate Infrastructure Scalability: Reports help determine if the current infrastructure can scale to meet growing user demands without compromising performance.
- Benchmark Performance: They provide a baseline to compare performance across different releases, environments, or configurations.
Key Components of Load Testing Reports
A load testing report includes the following components that help teams analyze performance, detect bottlenecks, and plan improvements.
1. Test Overview
This section explains the purpose of the test and the conditions under which it was run. It outlines what the team wanted to evaluate, such as system stability, response under peak load, or scalability limits. It specifies the user actions simulated during the test, like browsing, searching, or placing orders.
The team defines how long the test ran and how many virtual users were involved. It also details the pacing between user actions and the ramp-up pattern used to simulate real-world traffic growth.
Read More: What is Test Evaluation Report
2. Performance Metrics
This section presents raw performance data and helps interpret how the system behaved under load. The key metrics include:
- Response Time: This shows how long the system takes to respond. It is reported as an average, minimum, maximum, and across various percentiles.
- Error Rate: Indicates the percentage of failed requests. A higher rate may reveal unstable endpoints or unhandled exceptions during load.
- Throughput: It represents the number of successful transactions processed per second and helps assess the system’s efficiency as the number of users increases.
- Latency: It measures the delay between sending a request and receiving the first byte of the response. Sudden spikes in latency typically indicate issues with backend processing or network performance.
Read More: Throughput vs Latency Graph
- Resource Utilization: It measures how infrastructure resources respond during load and includes CPU and memory usage, disk I/O, database query time, and network saturation. These metrics help determine if the system needs more capacity or better tuning.
3. Graphs and Charts
This section visualizes test data to highlight patterns and anomalies. Key elements include:
- Line graphs: Show how responsiveness changes as load increases.
- Bar charts of error rates by endpoint: Help pinpoint which services fail more often under pressure.
- Heatmaps for resource usage: Indicate how infrastructure components behave over time.
These visualizations allow teams to detect trends like gradual performance degradation, sudden latency jumps, or resource exhaustion at high traffic levels. They are also valuable for sharing performance snapshots with non-technical stakeholders.
4. Detailed Results
This part includes granular data that supports root cause analysis. It breaks down:
- Endpoint-level performance: Shows how each API or service performs under load, revealing slow or error-prone paths.
- Threshold violations: Highlights where the system missed SLAs or predefined limits, such as a response time exceeding 2 seconds.
- Session-level logs: Provide insight into user journeys, failures, and inconsistencies during the test.
Read More: What is a Test Log?
These results enable teams to identify performance regressions, compare different builds, and validate improvements after changes.
5. Bottleneck Analysis
This section focuses on identifying where the system struggles under pressure. It draws on the metrics and visualizations to detect:
- Slow-performing endpoints: These often have high response times or high error rates under moderate load.
- Infrastructure limits: This includes CPU saturation, memory leaks, and overloaded databases.
- Third-party dependencies: External APIs that introduce latency or fail under concurrent access.
Read More: What is API Testing? (with Examples)
- Network constraints: Bandwidth caps, DNS lookup delays, or internal routing inefficiencies.
Read More: How to perform Network Throttling in Safari?
6. Recommendations
Recommendations help teams improve system performance, increase scalability, and resolve the issues observed during the load test. These suggestions are based on the metrics, bottlenecks, and errors identified in earlier sections.
Recommendations often include:
- Code optimizations: Refactor inefficient queries, reduce synchronous processing, and apply caching to reduce repeated computations or database calls.
Read More: What is Code Review?
- Infrastructure improvements: Scale server instances, enable auto-scaling policies, or introduce load balancers to better manage peak traffic.
- Configuration adjustments: Tune timeouts, thread pools, or queue limits to better handle concurrent requests.
- Dependency handling: Optimize the use of third-party services or APIs to reduce latency and improve reliability under load.
- Database tuning: Add indexing, batch updates, or partitioning to handle large data volumes more efficiently.
How to Read a Load Testing Report?
The steps below explain how to read and understand the report effectively.
1. Review the test overview
This section explains the test’s purpose and outlines the simulated test scenarios. Here’s how to review it.
- Check if the test type (average load, peak load, or stress) aligns with your performance goals.
- Confirm the number of virtual users and verify it against the expected real user traffic.
- Review the test duration to ensure it represents typical or peak usage periods.
- Verify the environment used and note any differences from the production setup.
- Use this section to determine if the test results can be relied upon for future planning and performance decisions.
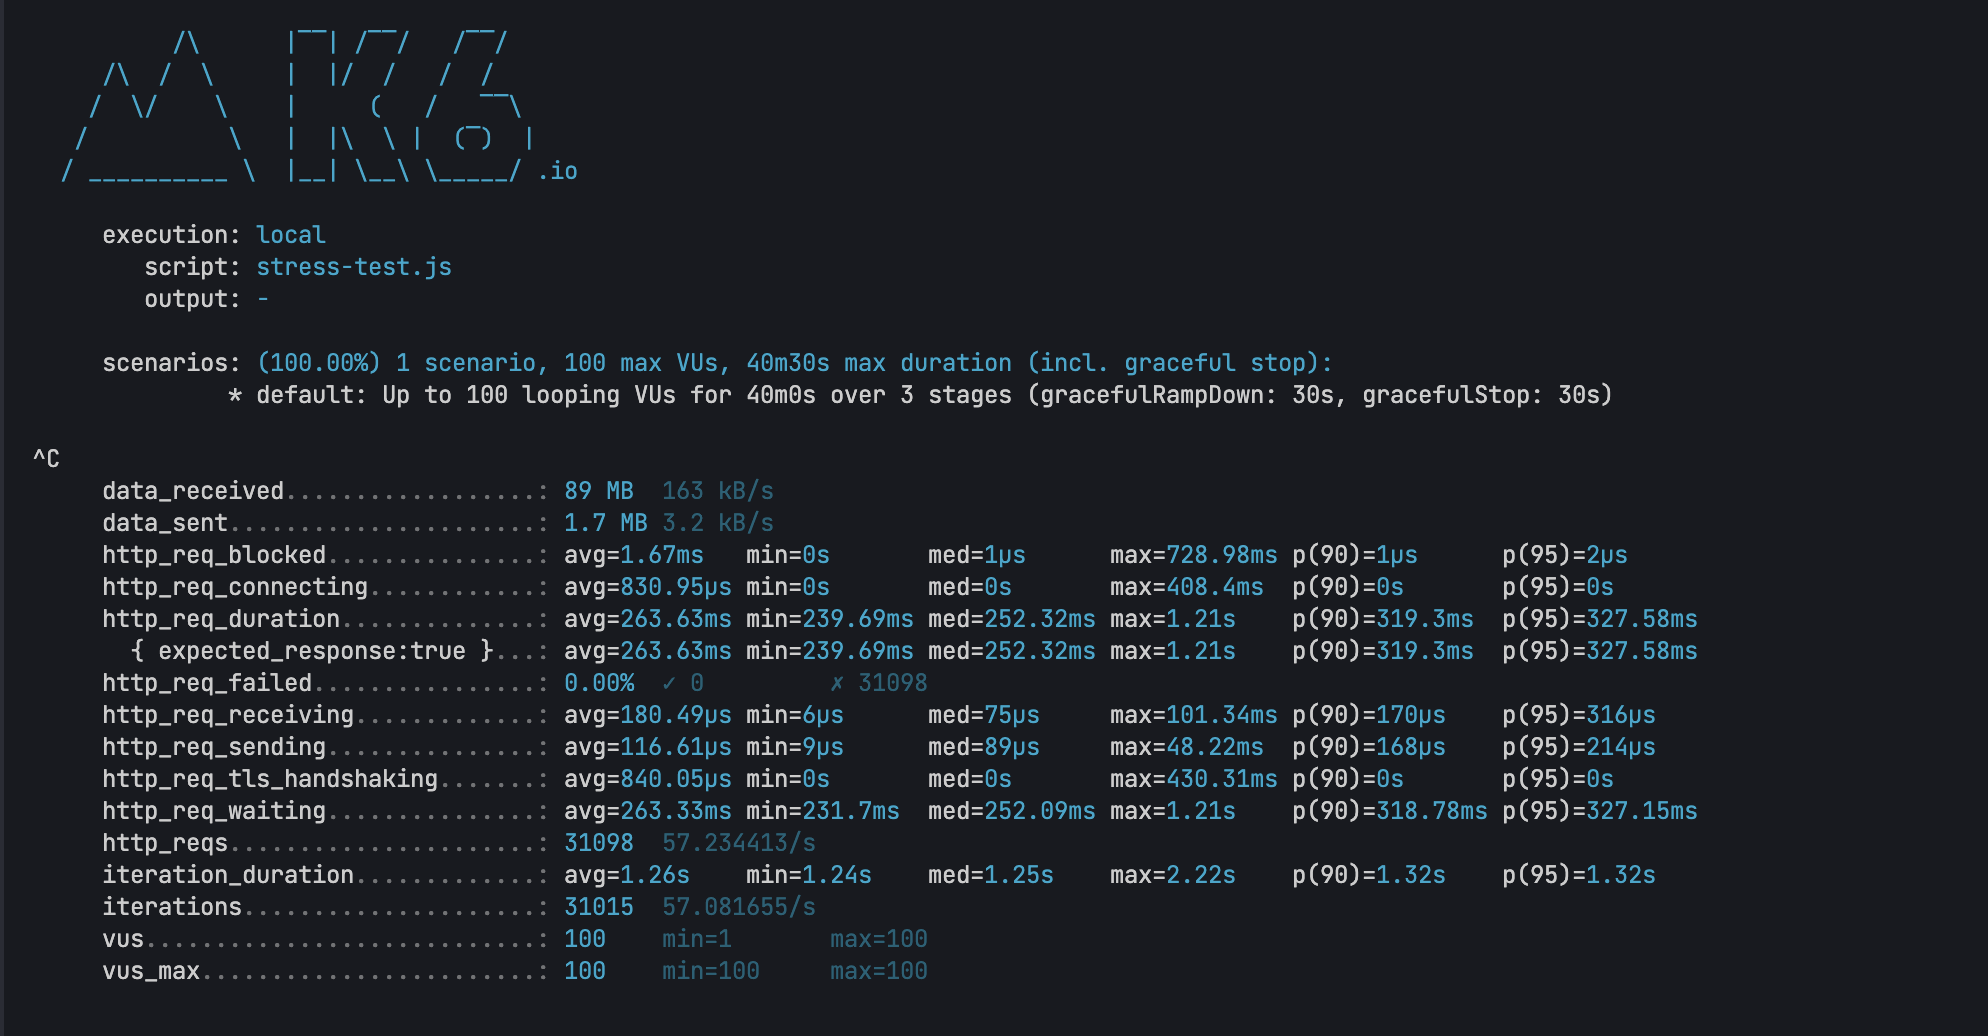
Below is a load testing report that shows performance metrics for various HTTP endpoints with response times and request counts from a 30-second stress test running 100 virtual users across 3 stages.
2. Identify Performance Bottlenecks
Performance metrics are critical in the load testing report. Look for the following indicators that can signal performance bottlenecks:
- High response time or sudden spikes during load increases.
- High error rates at specific user loads or requests.
- Elevated CPU or memory usage under load.
- Slow database queries that impact performance.
- Low throughput, meaning the system cannot handle the expected load.
These factors indicate whether the app is slow or performing well. If the app shows high throughput, balanced CPU and memory usage, and efficient database queries, it suggests it is performing well.
3. Correlate Metrics
Next, compare the metrics to identify cause-and-effect relationships. Correlating these metrics provides a more comprehensive view and helps pinpoint the root cause of performance issues.
- Increased memory usage could correlate with higher timeout occurrences.
- A spike in CPU usage often leads to slower response times.
- Decreased throughput typically indicates system overload.
4. Analyze Trends over Time
To identify recurring web performance issues, focus on patterns in the data that show how performance changes under varying load conditions. In the load testing report, monitor these key trends:
- Rising response times under higher load may indicate a memory leak, in which the system consumes more resources without releasing them, leading to slower performance.
- Peak load behavior shows where the system begins to struggle and causes latency. Identifying this threshold helps optimize for high traffic.
- Sudden error spikes suggest the system has reached its resource limit. This could be with the CPU, database, or network, and leads to failures.
5. Compare Against Baselines
Baseline comparisons are essential for detecting performance regressions after code changes or deployments. Use this to:
- Compare the current test results with those from the previous week to see how performance has changed.
- Look at the results post-deployment to identify any performance degradation or improvements.
- Validate results against the expected Service Level Agreement (SLA). For instance, if an endpoint is expected to complete within 500 ms, compare actual results to this benchmark.
6. Prioritise Optimization Efforts
Use the load testing report to identify areas for performance improvement. Focus on high-impact, low-effort fixes that provide the greatest performance boost. Look for:
- Endpoints that have high latency or failure rates
- Critical business paths that affect functionality
- Aspects that impact user experience
Read More: Top 15 Ways to Improve Website Performance
Re-Validate Load Test Issues in Real User Scenarios with BrowserStack
Load testing reports reveal performance metrics like response times, throughput, and error rates, but interpreting these numbers in isolation doesn’t always clarify how issues affect actual user experience. Teams often struggle to connect backend performance data with real-world application behavior under stress.
BrowserStack Load Testing provides unified reporting that combines frontend and backend metrics in a single dashboard, making it easier to validate performance issues and understand their real impact. Teams can observe how identified bottlenecks affect complete user workflows rather than analyzing disconnected data points.
Key advantages of BrowserStack Load Testing reports:
- Unified frontend and backend visibility: View page load times alongside API response durations and error rates in one dashboard instead of correlating metrics from separate tools and reports.
- Real-time performance tracking: Monitor how applications behave during test execution to identify exactly when and where performance degrades under concurrent user load.
- Geographic performance insights: Analyze how response times and error rates vary across different load zones to identify location-specific issues that aggregate reports might miss.
- Detailed execution traces: Access comprehensive logs, error traces, and network data within reports to move quickly from identifying issues to understanding root causes.
- Actionable performance data: Review reports that connect system metrics directly to user experience indicators, making it clear which bottlenecks require immediate attention versus acceptable performance variations.
Conclusion
Load testing reports reveal critical performance issues before they impact users. Through targeted analysis and optimization, teams can ensure their applications remain reliable even under stress.
However, it is important to perform load testing on real devices as it helps validate performance in real user scenarios. BrowserStack gives you access to 3,500+ real devices and browsers to test your application under real-world conditions. You can access screenshots and logs to identify issues that impact your application’s performance and enhance user experience.


