iOS offers a range of tools such as XCTest and Xcode Instruments that allow developers to track key performance indicators like execution time, memory consumption and frame rendering speed.
Overview
What is iOS Performance Testing
Performance testing in iOS is a crucial process that ensures an app behaves efficiently across different devices, iOS versions, and usage conditions. It involves measuring how quickly screens load and how the app responds under stress or limited resources.
iOS Performance Testing Benefits
- Smooth User Experience
- Reduces App Crashes and Freezes
- Optimizes for Real Devices
- Catches Issues Early in Development
- Improves Battery and Resource Usage
- Enables Continuous Improvement
Best Tools for Conducting iOS Performance Tests
- BrowserStack (App Live and App Automate)
- Xcode Instruments
- XCTest
- Firebase Performance Monitoring
- Charles Proxy
This article explores how to conduct iOS performance testing, the tools involved and the best practices to follow for building smooth and responsive iOS applications.
What is iOS Performance Testing?
Performance tests in iOS measure how efficiently an app runs under specific conditions, such as loading screens, handling user actions, or performing background tasks. These tests help developers understand how much time, memory, and CPU power their app uses during certain operations.
For example, when a user opens a product listing page or submits a form, the app should respond quickly and without lag. Performance tests simulate these actions and track how long they take, how much memory is consumed, and whether the app remains stable. By running these tests early and often, developers can catch slowdowns, memory leaks and other performance issues before users experience them, leading to a smoother and more reliable app.
Read More: How to Debug iOS App in Chrome
Importance of iOS Performance Testing
Here’s why performance testing matters:
- Delivers Smooth User Experience: Ensures the app feels fast, fluid and responsive without lags or delays during interactions.
- Reduces App Crashes and Freezes: Helps detect performance bottlenecks like memory leaks or CPU spikes that could cause the app to crash.
- Optimizes for Real Devices: Verifies that the app performs well across different iPhones and iPads, not just in simulators.
- Catches Issues Early in Development: Identifies slow screens, heavy processes, or unoptimized code before the app reaches users.
- Improves Battery and Resource Usage: Ensures the app doesn’t drain battery or consume excessive memory or processing power.
- Enables Continuous Improvement: Regular performance tests help teams track regressions and improve speed and efficiency with each update.
What is XCTest?
XCTest is Apple’s official testing framework used to write and run tests for iOS, macOS, watchOS and tvOS applications. It allows developers to create unit tests, UI tests and performance tests directly within Xcode.
XCTest is built into the development workflow, making it easy to test code logic and app behavior as part of the build process. For performance testing specifically, XCTest offers tools like XCTMeasure and XCTMetric that help developers measure how fast certain operations run, how much memory they use, and how efficiently the app performs overall. Because XCTest is tightly integrated with Xcode, test results are presented in a clear, interactive format – making it easier to identify issues, track improvements and maintain app quality over time.
Measurement Metrics in XCTest and Their Use Cases
XCTest offers a set of built-in metrics designed to measure different aspects of app performance. These metrics help identify issues related to speed, memory, CPU, and storage usage during test runs. Each metric focuses on a specific system behavior and can be used within the measure(metrics:) block to gather precise performance data.
Key Metrics:
1. XCTMetric (Base Protocol): Serves as the foundation for all performance metrics in XCTest. It defines the structure and behavior that all specific metric types must follow, such as CPU, memory, clock time and others.
Use Cases:
- Enables consistent handling of different performance metrics in test cases.
- Allows combining multiple metrics in a single measure (metrics) block.
- Supports extensibility for tracking custom performance aspects using metric subclasses.
2. XCTCPUMetric: Measures CPU usage during a test run.
Use Cases:
- Detecting high CPU usage during image processing.
- Monitoring performance during large JSON parsing.
- Identifying spikes caused by background tasks or data transformations.
3. XCTClockMetric: Measures the total time (wall clock time) taken to execute a block of code.
Use Cases:
- Measuring time taken to complete an API call.
- Tracking screen load durations or animation times.
- Validating performance of background operations.
4. XCTMemoryMetric: Monitors physical memory usage during test execution.
Use Cases:
- Identifying memory leaks in view controllers or services.
- Testing memory usage during large image or video asset loading.
- Ensuring memory efficiency in continuous data processing tasks.
5. XCTOSSignpostMetric: Tracks execution time of custom code sections using system signposts.
Use Cases:
- Profiling specific functions, such as rendering or encoding.
- Measuringthe performance of database read/write operations.
- Evaluating the execution time of isolated critical processes.
6. XCTStorageMetric: Monitors the amount of data written to or read from device storage.
Use Cases:
- Checking the efficiency of file caching mechanisms.
- Tracking disk writes from logs or temporary files.
- Detecting redundant or excessive write operations.
7. XCTApplicationLaunchMetric: Measures the time it takes for the app to launch.
Use Cases:
- Verifying cold start and warm start times.
- Ensuring compliance with Apple’s startup performance guidelines (400ms for cold, 200ms for warm starts).
- Monitoring launch time consistency across updates.
Read More: How to perform XCode UI testing?
How to Perform iOS Performance Testing with XCTest
XCTest provides a structured way to measure the performance of iOS app code within Xcode, making it ideal for identifying slow functions, optimizing app responsiveness, and maintaining consistent performance across releases.
Steps to Perform Performance Testing with XCTest
1. Open the iOS project in Xcode: Navigate to the workspace or project intended for testing and ensure it is correctly configured for unit testing.
2. Create or open a test case class: In the Test Navigator, create a new test class or open an existing one that targets the desired module.
3. Define a performance test method: Inside the class, add a method using the measure function to evaluate code performance.
Example:
func testScreenLoadPerformance() {

     measure {

         // Place the code block to be measured here

         let viewController = HomeViewController()

        viewController.loadViewIfNeeded()

     }

}
4. Add metrics if needed: To measure specific system aspects (like CPU or memory), use the measure(metrics:) function along with XCTMetric types.
func testMemoryUsage() {

     measure(metrics: [XCTMemoryMetric()]) {

         // Code that may consume memory

     }

}
5. Run the test: Use the Test navigator or shortcut (Command + U) to execute the test. Xcode will run the test multiple times and gather performance data.
6. Analyze the results: Xcode will display average execution time, standard deviation, and detailed graphs in the Test Report tab. This helps in identifying whether the code meets performance expectations or requires optimization.
7. Iterate and optimize: Based on the results, the code can be refactored or optimized. The test can be re-run to confirm improvements or catch regressions.
Limitations of Using XCTMetric
While XCTMetric is a powerful feature within the XCTest framework for measuring app performance, it is not without limitations.
Some of the limitations include:
- Limited Real-World Simulation: XCTMetric tests are typically run in static environments and may not reflect actual usage conditions like varying network speeds, device temperatures, or background processes.
- Simulator Inaccuracy: Performance tests using XCTMetric in a simulator may produce unreliable results, as simulators do not mimic real device behavior accurately.
- Device Dependency: Accurate metrics often require testing on physical devices. Performance results can vary significantly between device models and iOS versions.
- No UI-Level Performance Feedback: XCTMetric focuses on backend performance (e.g., CPU or memory usage) but does not capture UI issues such as animation lags or frame drops.
- Basic Reporting Features: The results provided by XCTMetric are helpful but limited in detail. More advanced visualizations or long-term trend tracking require external tools.
- Manual Interpretation Needed: The collected metrics still need manual analysis and comparison to determine whether the performance is acceptable or needs optimization.
How to Run iOS Performance Tests via BrowserStack App Live
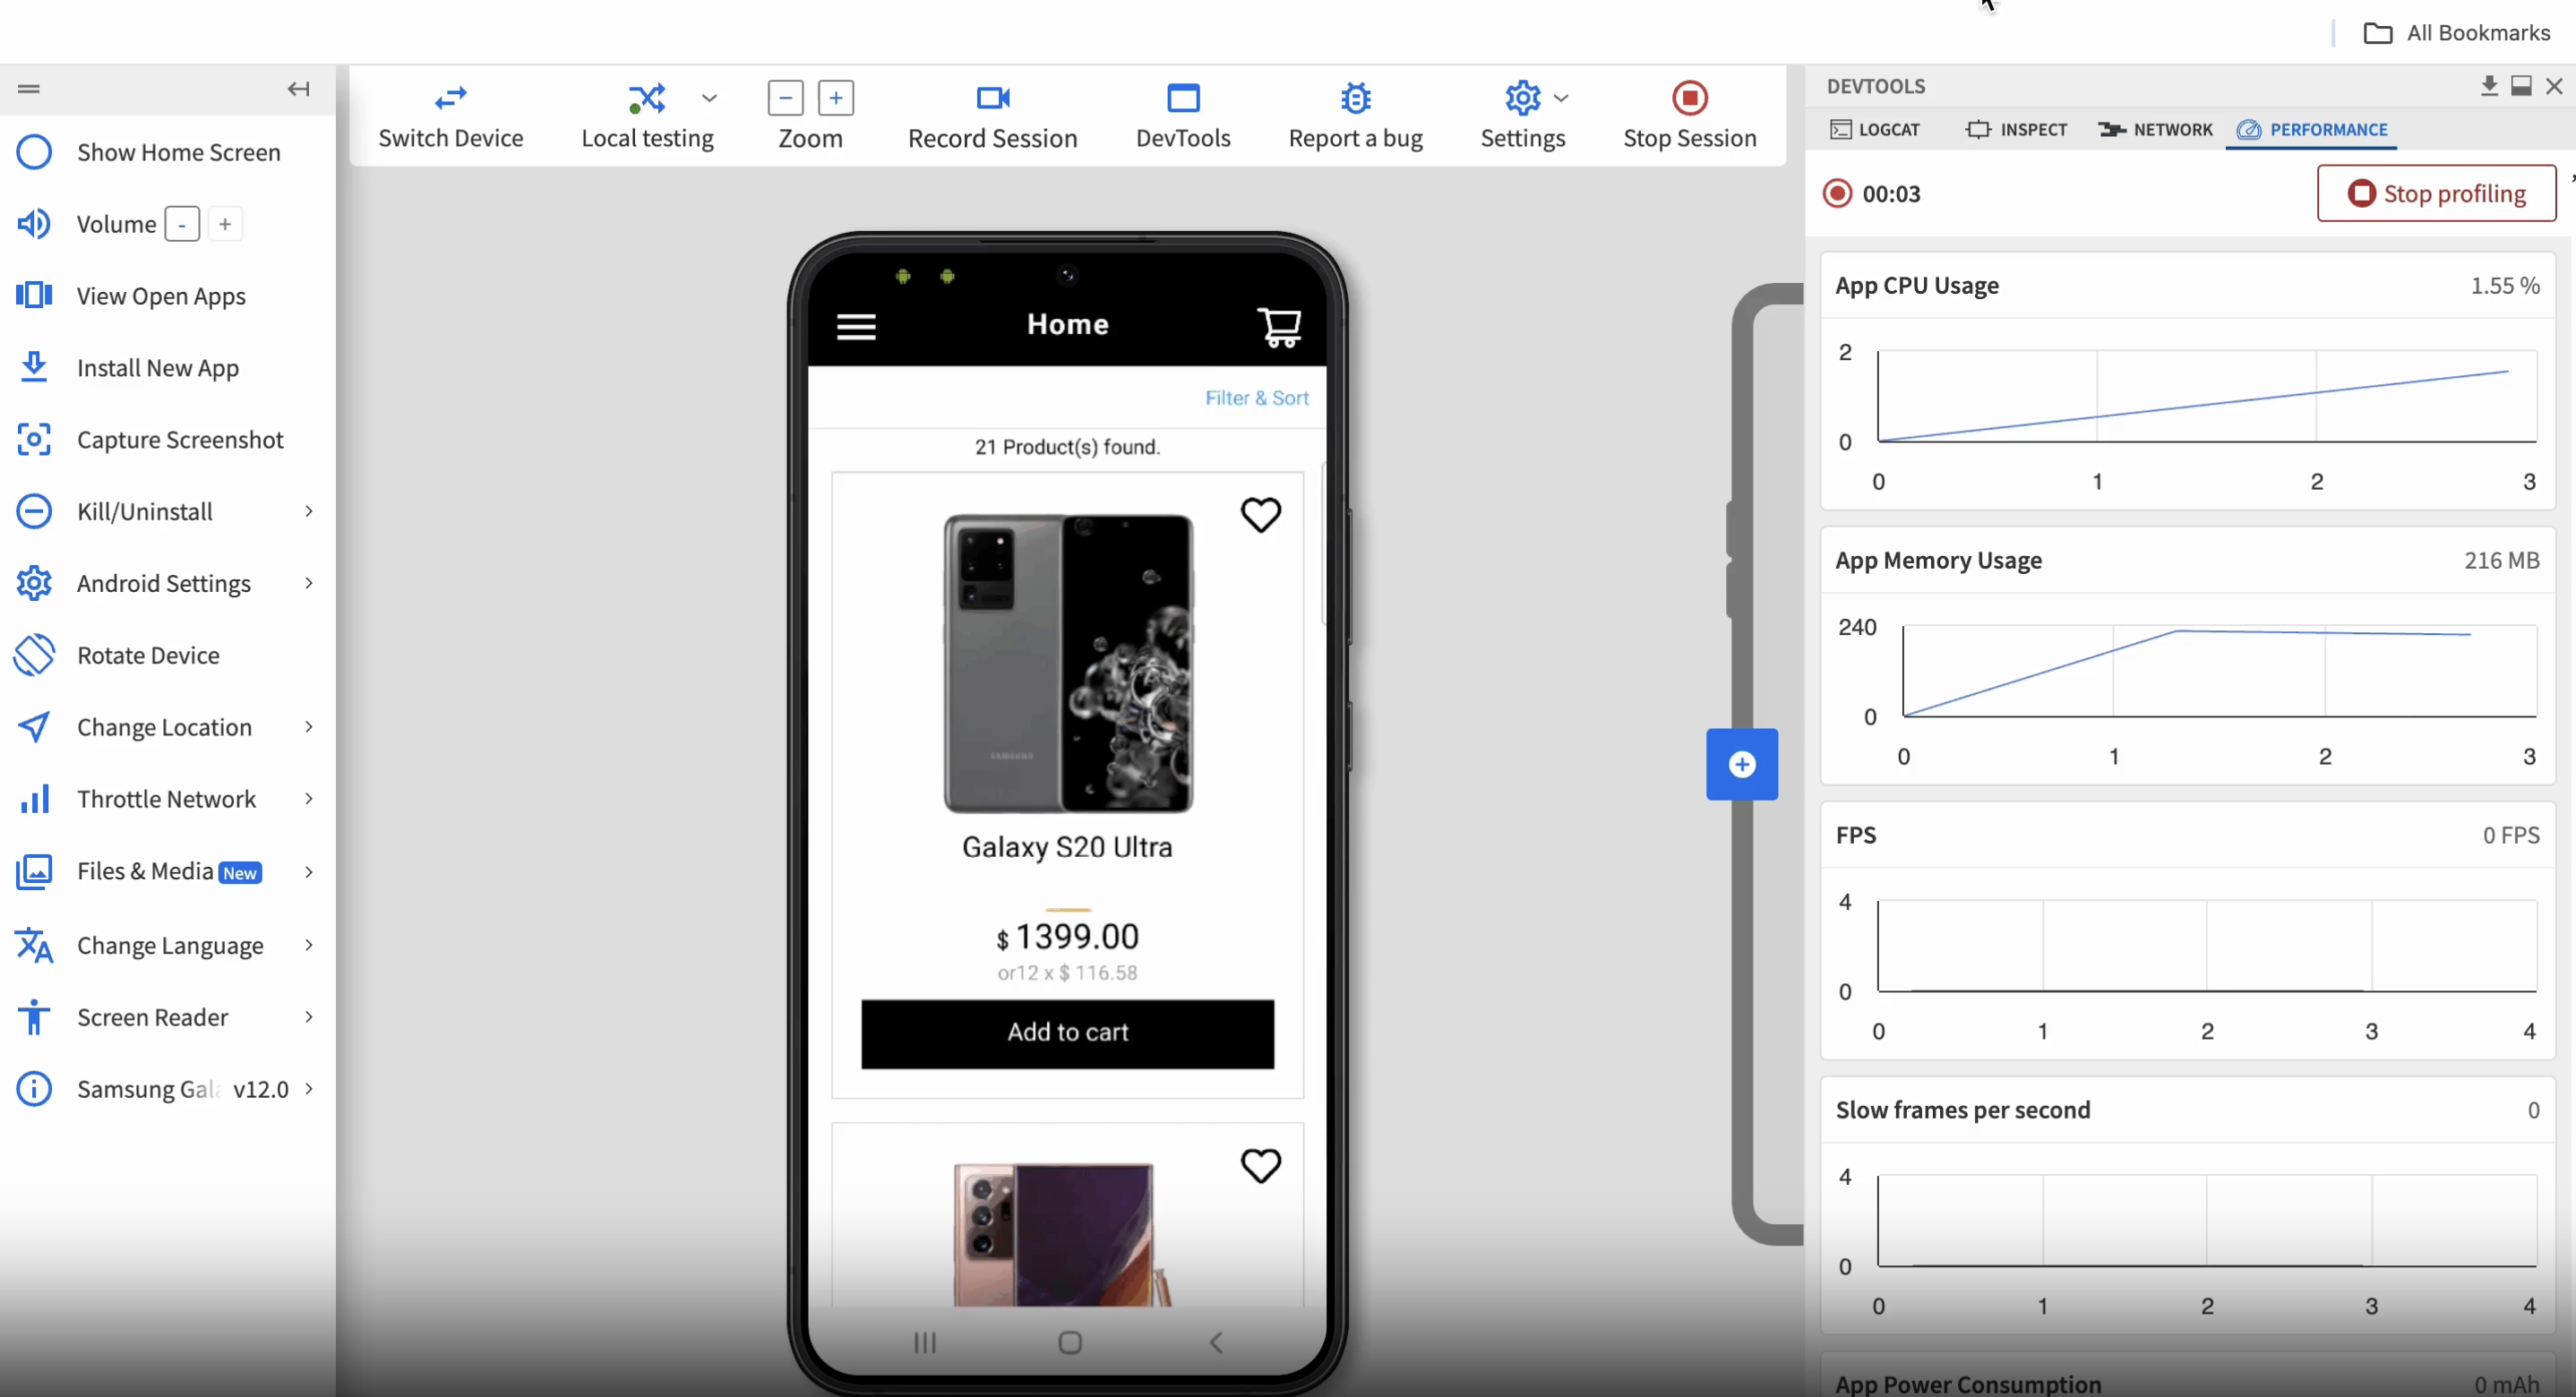
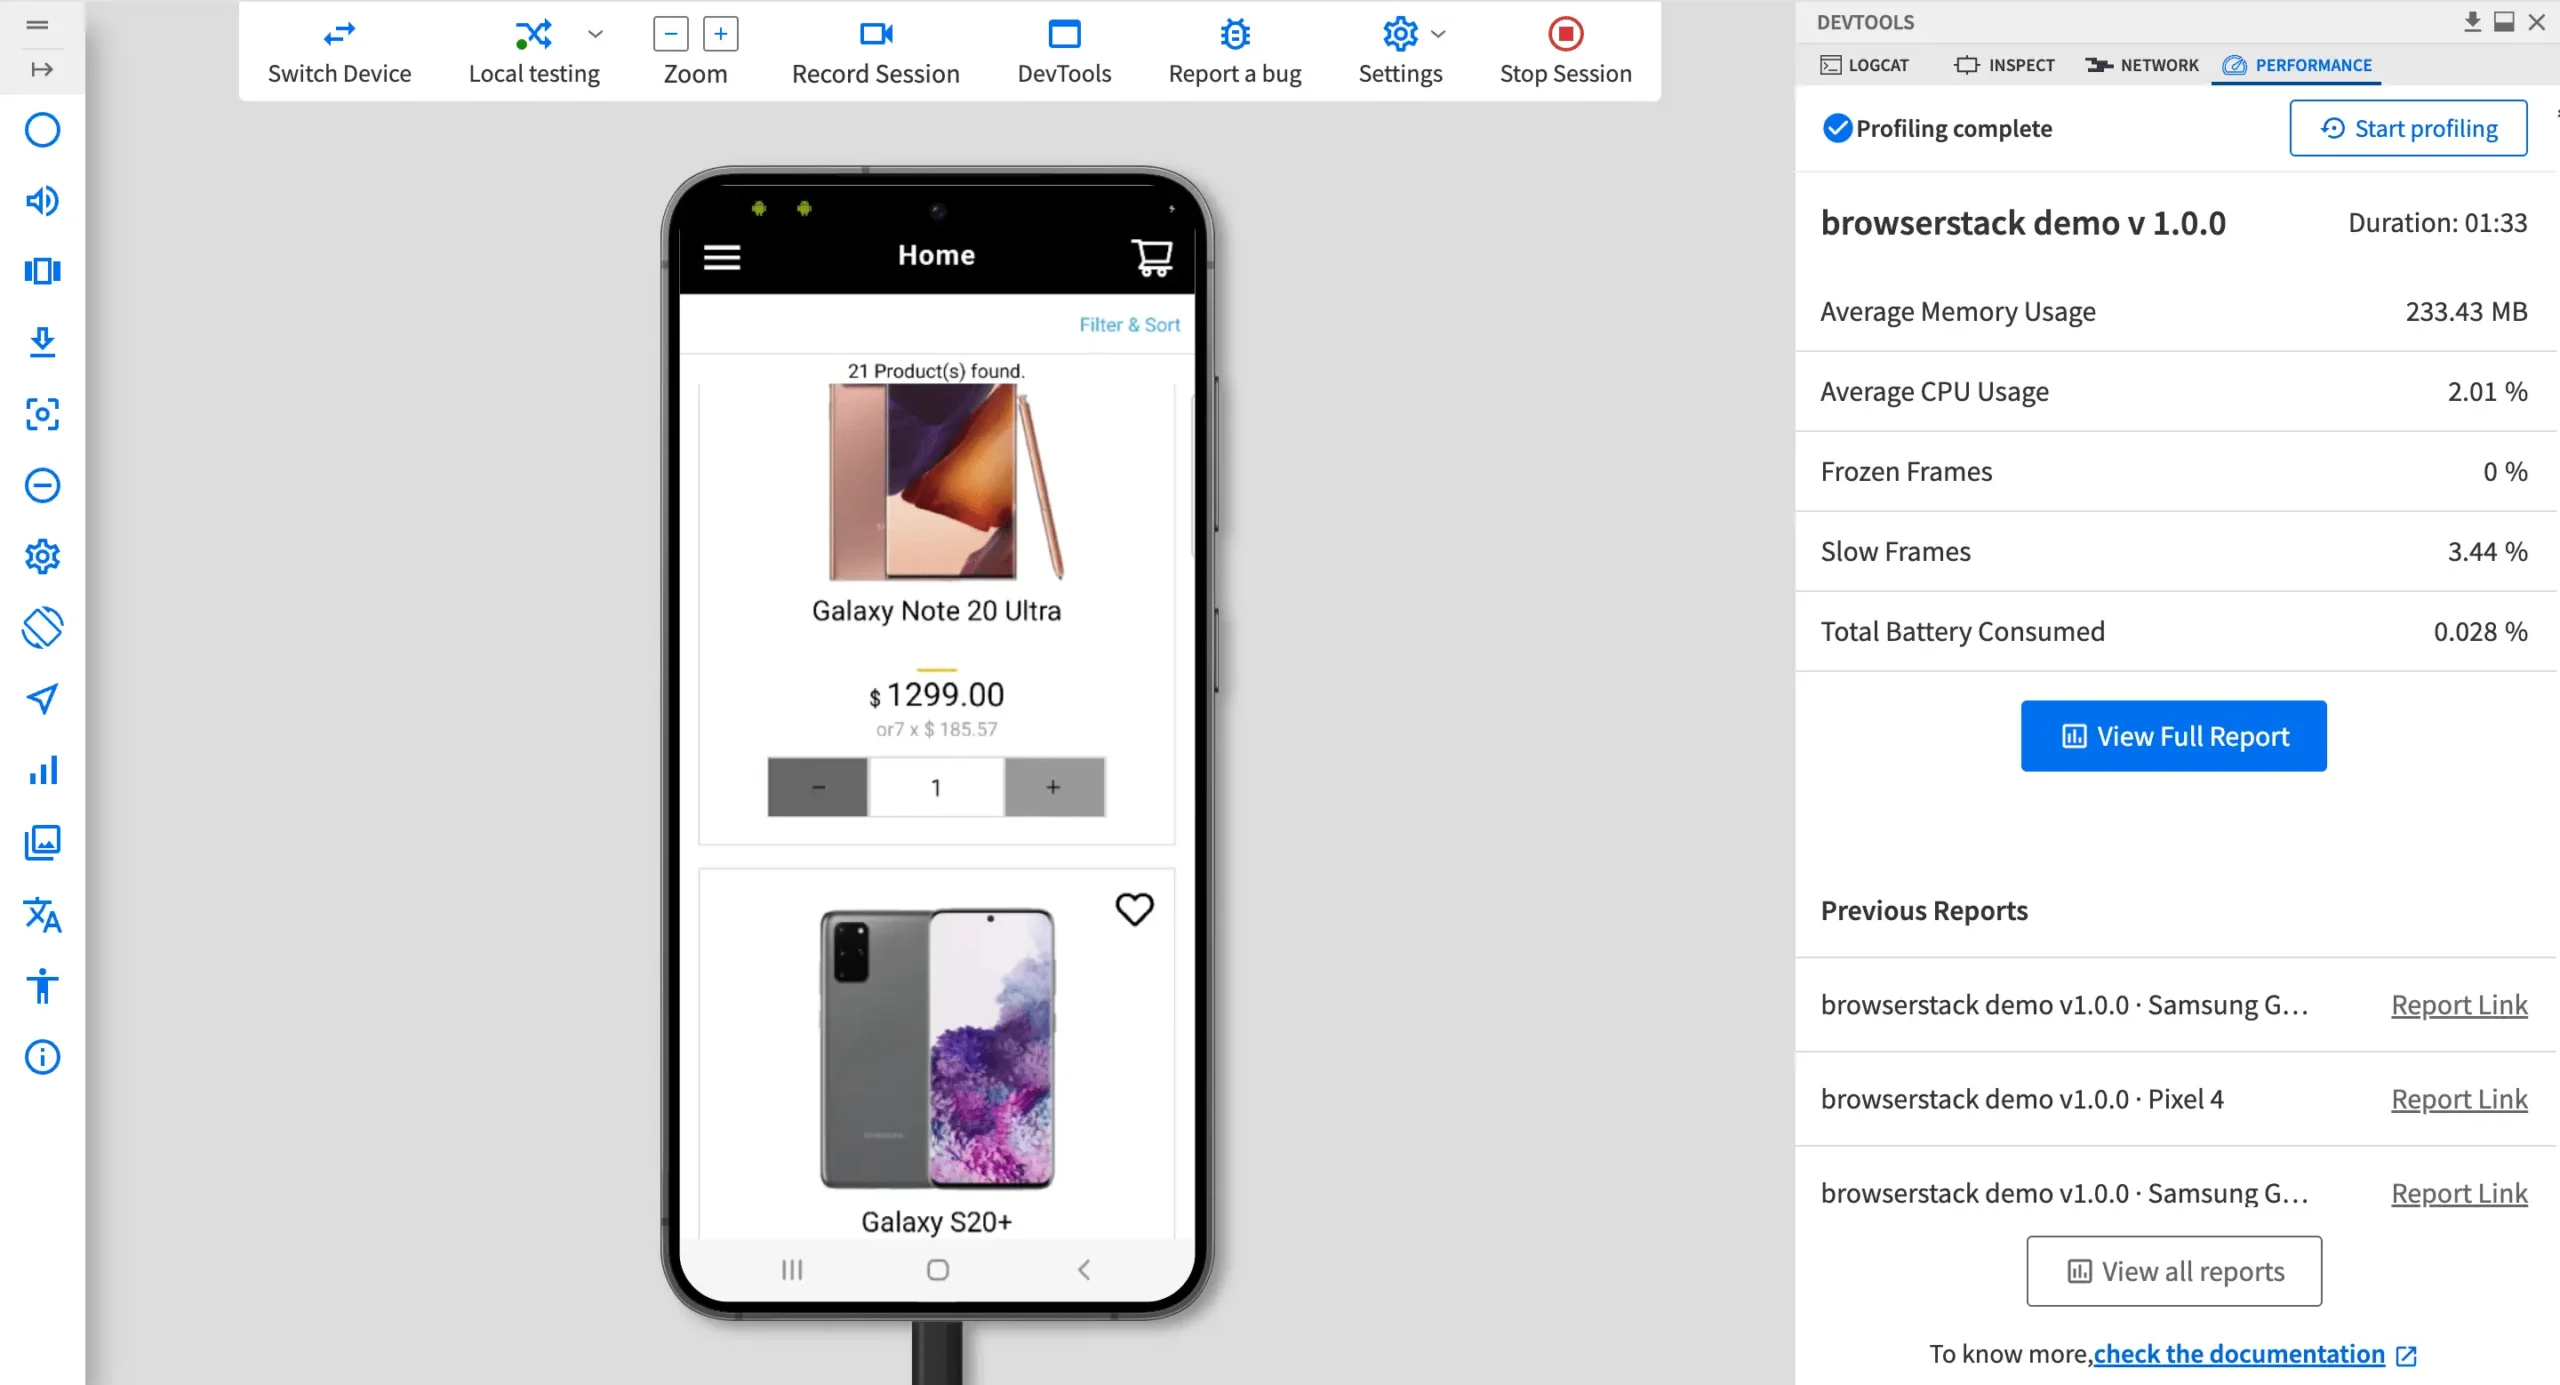
BrowserStack App Live allows teams to test and profile app performance directly on real iPhones and iPads, without the need to maintain a physical device lab. It provides detailed insights such as CPU usage, memory consumption, rendering delays, and more through its DevTools Performance tab.
However, performance profiling on App Live is only supported for apps uploaded directly via the Uploaded Apps option. Apps installed from TestFlight or the App Store are not supported for profiling.
Steps to Run iOS Performance Tests on App Live:
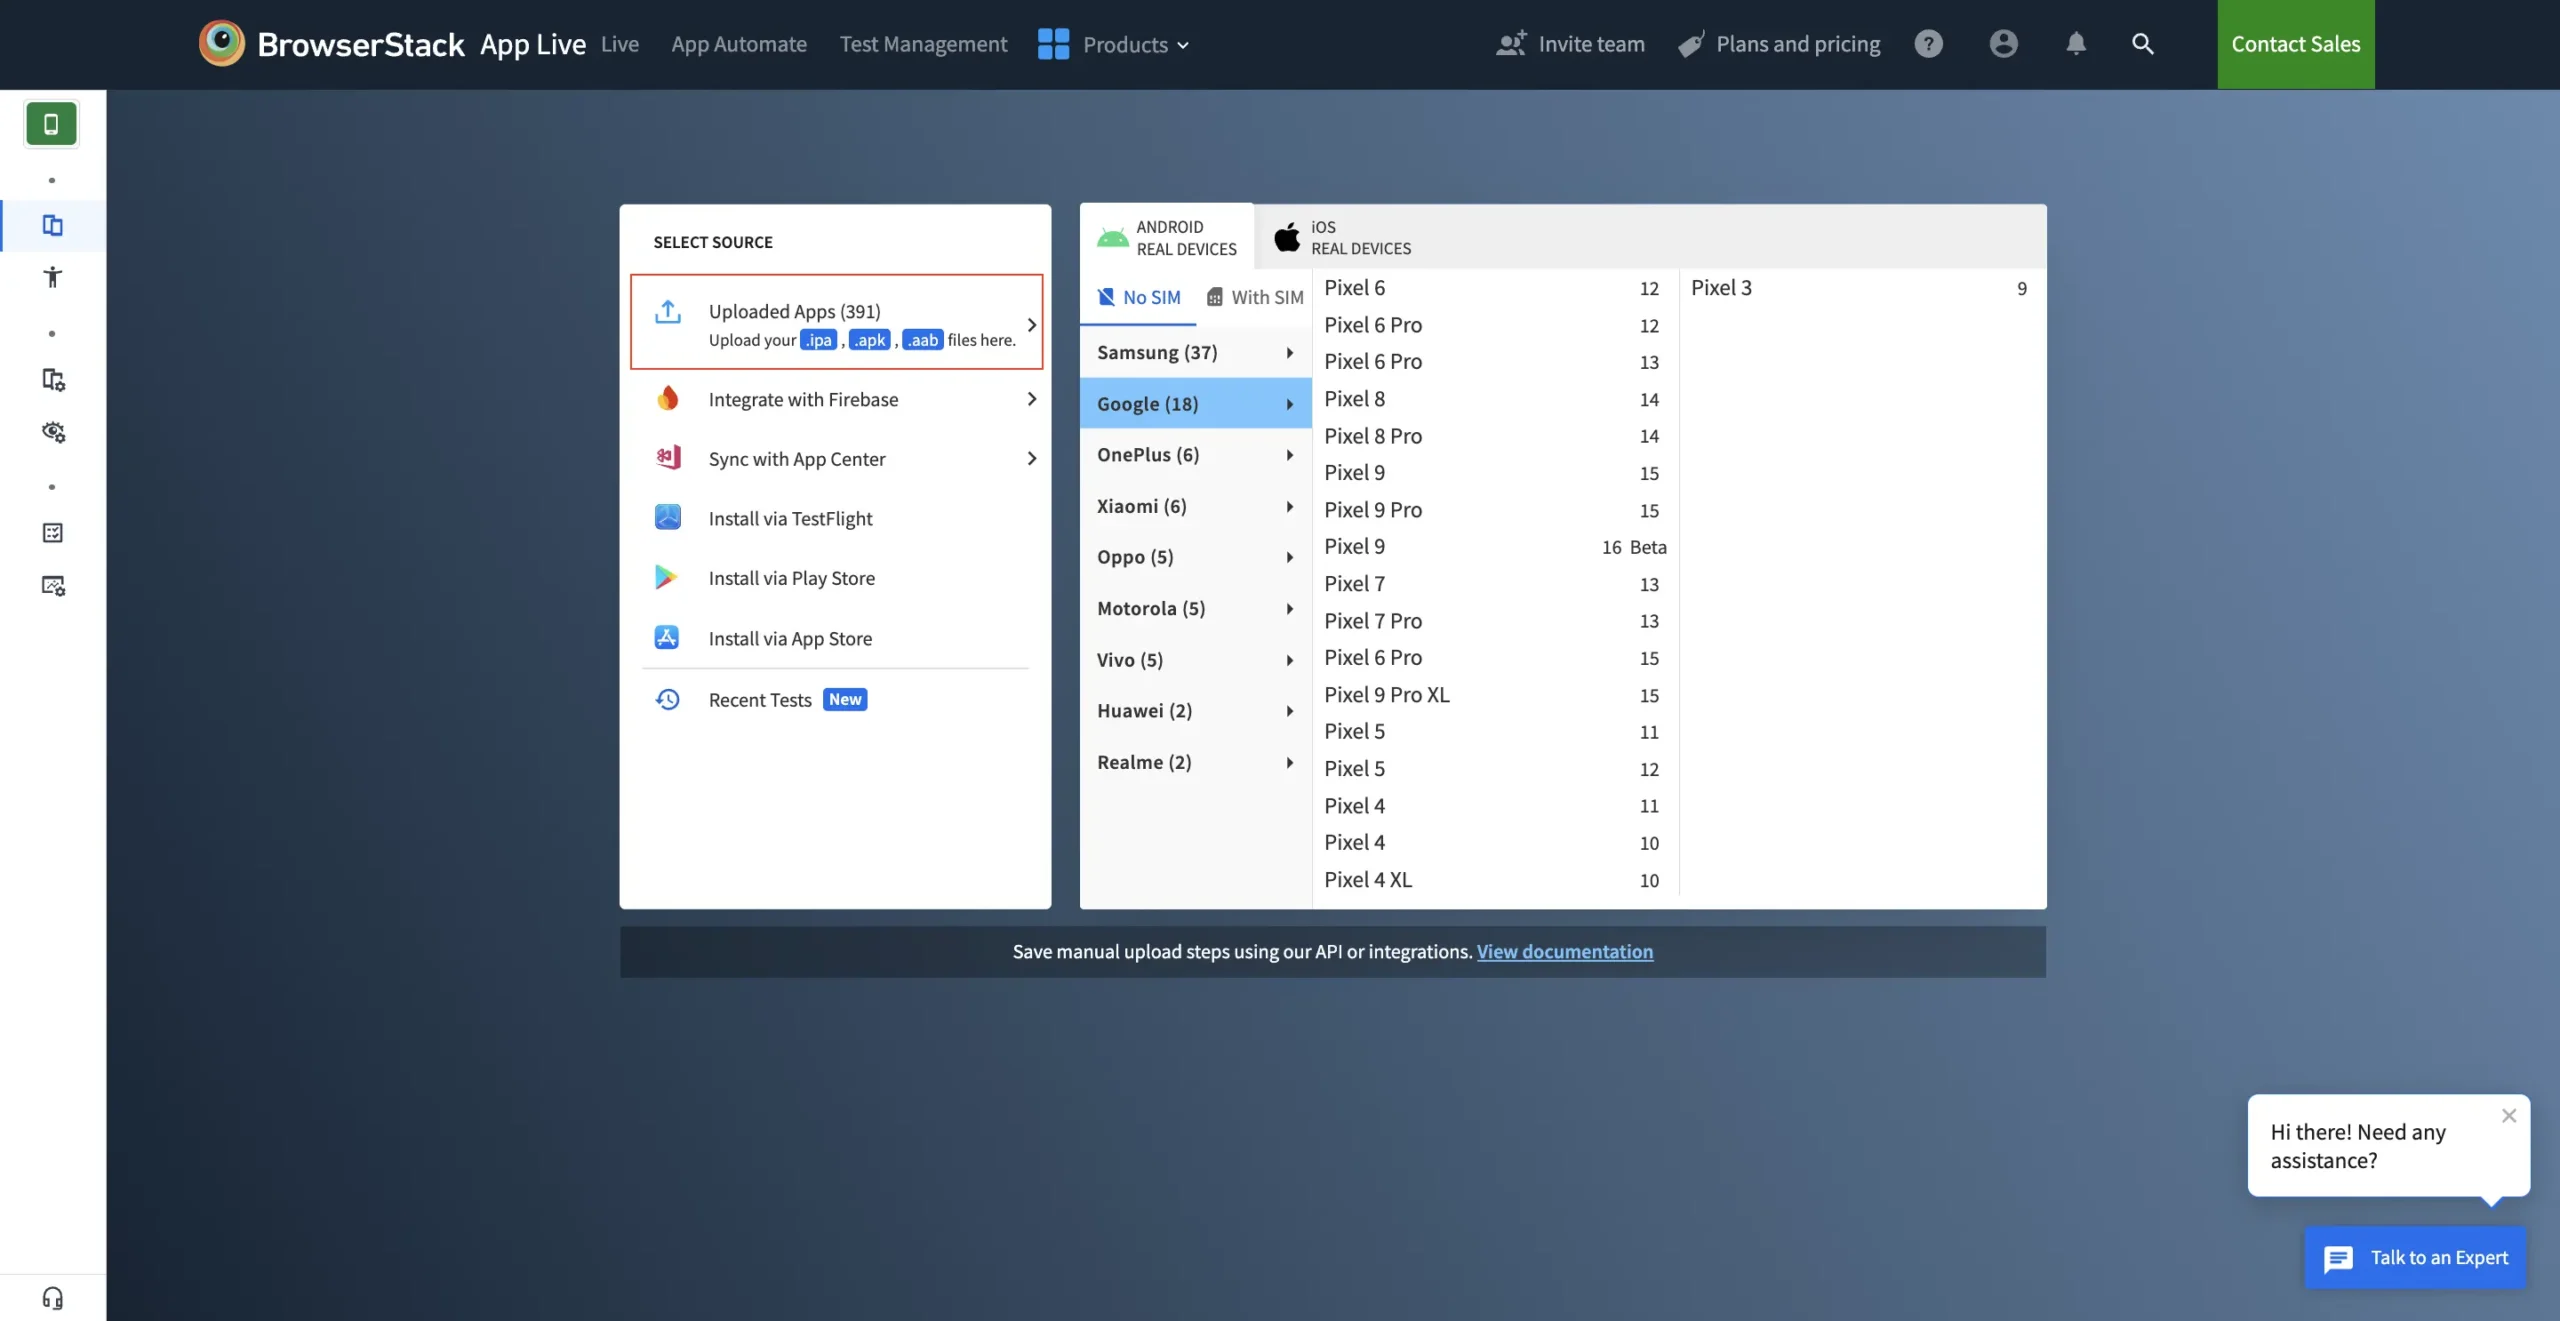
1. Log in to the App Live dashboard: Access the BrowserStack platform and open the App Live dashboard.
2. Upload and select the app: Ensure the app has been uploaded using the Uploaded Apps method. Select the app and choose an iOS device to begin the session.
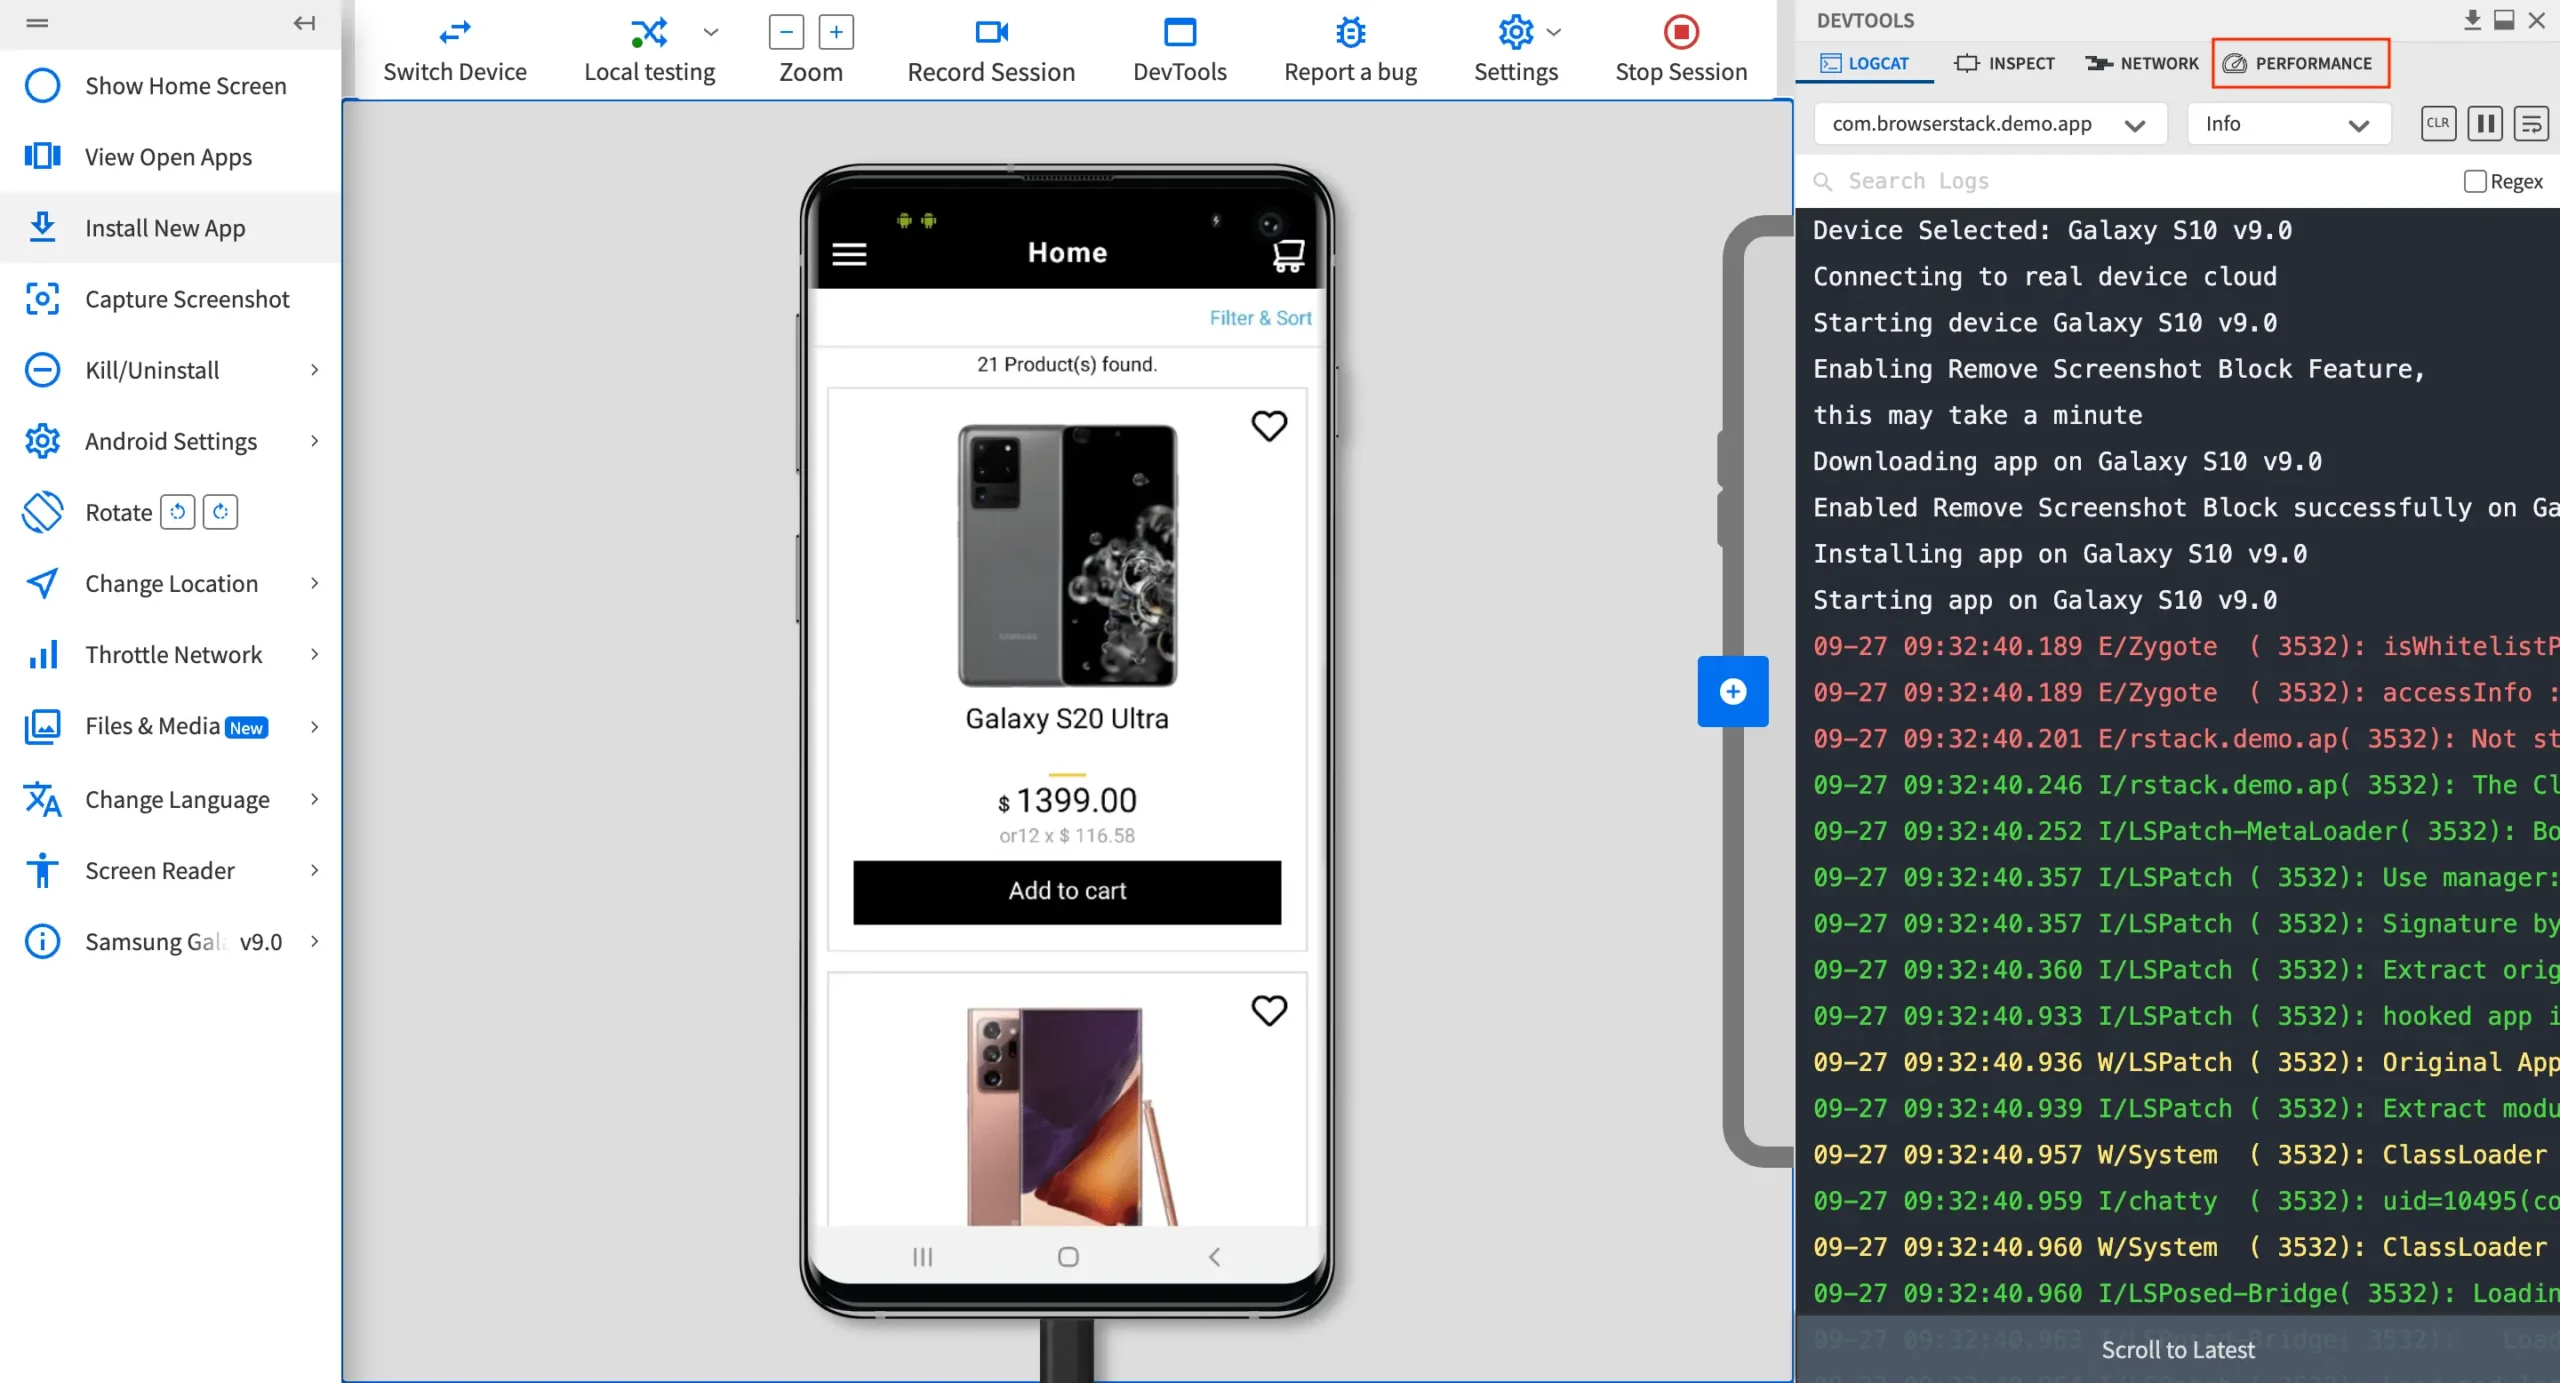
3. Launch the test session: Once the app launches on the selected device, the DevTools panel will appear automatically. If closed, it can be reopened by clicking the DevTools option in the top toolbar.
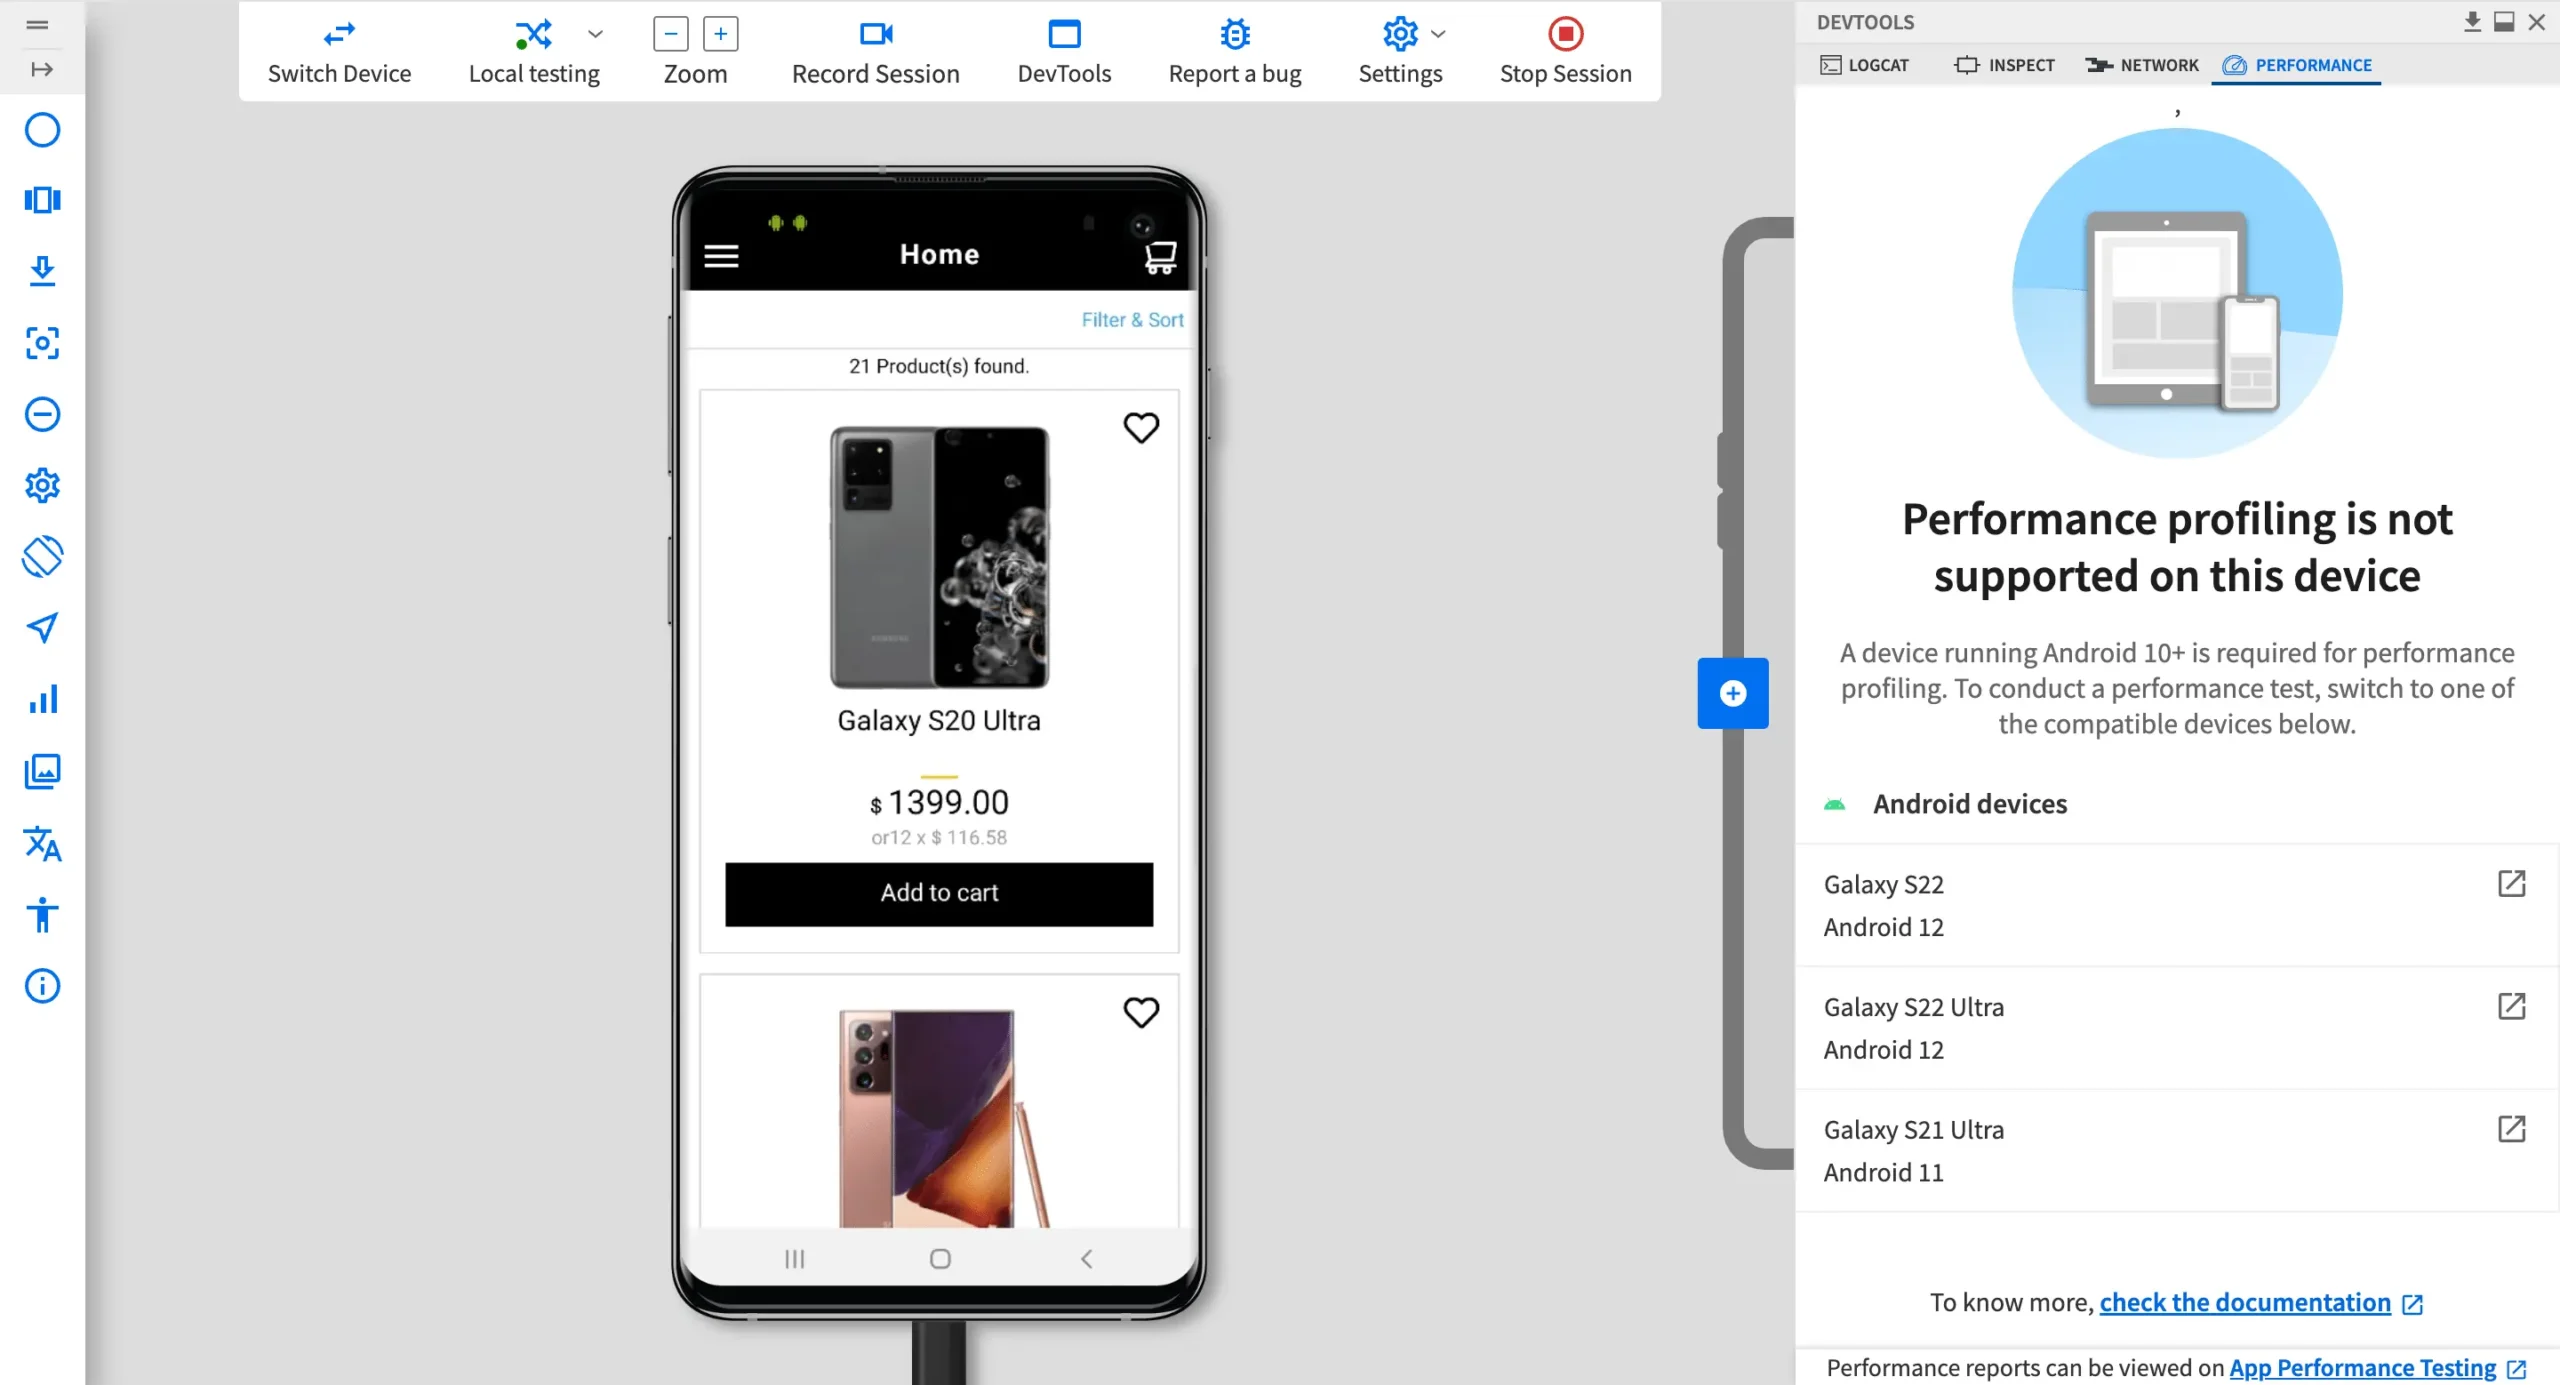
4. Open the PERFORMANCE tab: In the DevTools pane, click on the PERFORMANCE tab to access performance testing features. If the selected device is not compatible, a prompt will appear with a list of supported iOS devices. Switch to one of the compatible devices to continue.
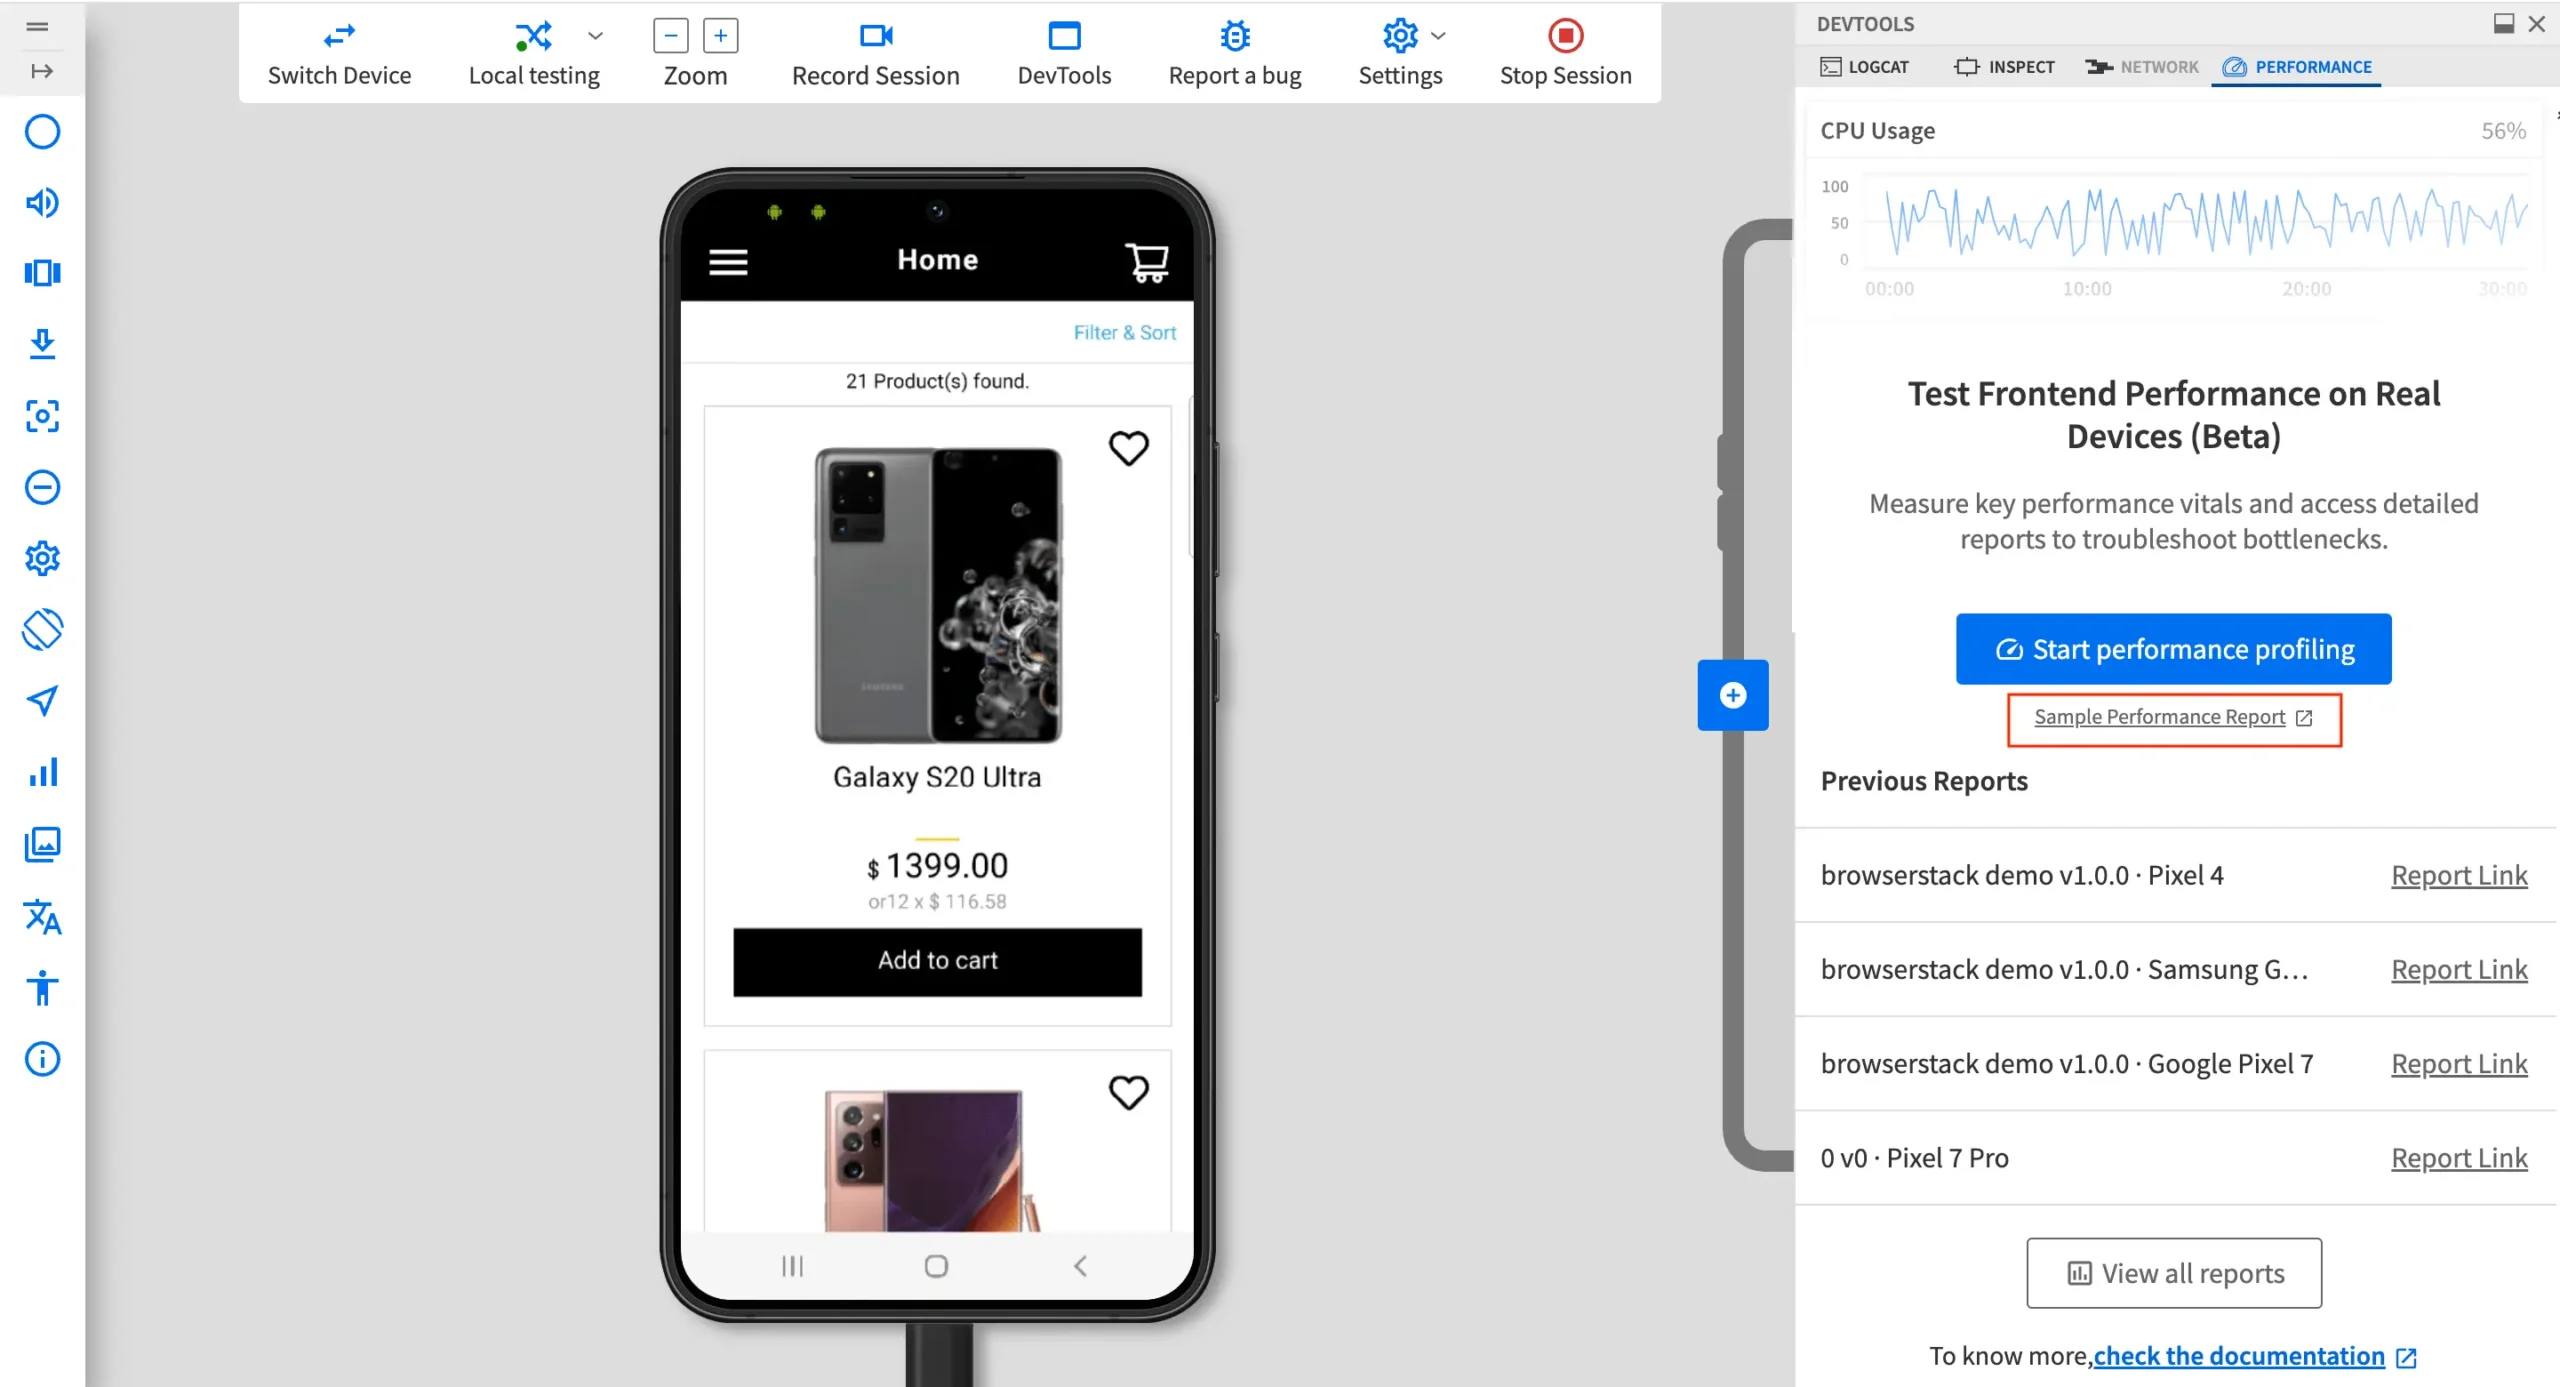
5. Preview performance insights (Optional): Before beginning the profiling session, click Sample Performance Report to preview a sample PDF showing the types of performance metrics that will be captured during testing.
6. Start performance profiling: Click Start performance profiling to begin tracking performance data. The profiling starts immediately.
7. Perform test actions on the app: Interact with the app and complete the specific user flow intended for testing, such as login, screen transitions, API calls, or data-heavy interactions.
8. Stop profiling and view results: Once the test is complete, click Stop profiling. A summary of the test results will appear immediately.
Why Use BrowserStack App Live to Enhance iOS Performance Tests
BrowserStack App Live offers a cloud-based platform that enables real-time testing on actual iOS devices and helps teams validate performance in realistic conditions, without relying solely on simulators or limited internal device labs.
Key Benefits of Using BrowserStack App Live
- Access to a Wide Range of Real Devices: Supports testing on the latest and legacy iPhone and iPad models with various iOS versions.
- No Device Maintenance Required: Eliminates the need for maintaining physical devices, reducing overhead and infrastructure costs.
- Real-World Condition Simulation: Enables testing under actual network conditions, including poor connectivity or 3G/4G throttling.
- Built-in Debugging Tools: Offers access to console logs, device logs and crash reports during live sessions for in-depth analysis.
- Live Video Recording and Screenshots: Captures performance tests visually for better communication, reporting, and issue tracking.
- Secure Testing : Ensures data privacy with enterprise-grade security and device clean-up after each session.
- Collaborative Testing: Allows test sessions to be shared via links, enabling better collaboration between developers, testers, and stakeholders.
Running iOS Performance Testing on CI
iOS performance testing can be seamlessly integrated into Continuous Integration (CI) pipelines using tools like GitHub Actions or Jenkins. By using XCTest with XCTMetric and executing tests via xcodebuild, performance metrics such as execution time, memory usage, and CPU load can be automatically collected. After test execution, results are saved in a .xcresult file, which can be parsed using xcresulttool to extract detailed performance data.
This enables teams to track trends, detect regressions early, and maintain consistent app performance across builds. Thresholds can be defined to fail builds if performance degrades, allowing automated quality control without manual checks.
Read More: Top 18 Continuous Integration Tools in 2025
Best Tools for Conducting iOS Performance Tests
Here are some top tools to support iOS performance testing:
1. BrowserStack (App Live and App Automate)
App Live
BrowserStack App Live is designed for real-time, interactive performance testing of applications on 30,000+ real devices (iOS and Android), including multiple iPhone and iPad models, iOS versions, and configurations.
It allows testers and developers to assess how an app performs in real-world scenarios by accessing authentic device hardware, sensors, and network conditions. This makes it ideal for analyzing UI responsiveness, rendering consistency, and end-user experience on iOS devices.
Key Features:
- App Profiling: Monitor live performance metrics such as FPS, ANR rate, page load times, and resource utilization directly on real iOS devices.
- Performance Report: Generate detailed audit reports summarizing critical performance insights, bottlenecks, and recommendations for optimization.
- Interactive Debugging: Use session replays and correlated metric graphs to trace performance hotspots across user journeys.
- Real-Time Device Access: Test instantly on real iPhones and iPads with configurable iOS settings, sensors, and network profiles for accurate frontend validation.
App Automate
BrowserStack App Automate enables teams to automate iOS performance testing at scale, seamlessly integrating with CI/CD pipelines for continuous performance validation. By running automated test suites on a wide range of real iPhones and iPads, teams can identify regressions, benchmark builds, and ensure consistent app behavior across OS versions and devices.
Key Features:
- Automated Performance Tests: Run repeatable performance scenarios on real iOS devices to measure startup time, frame stability, and resource usage.
- App Performance Dashboard: Visualize trends across builds with detailed analytics on CPU, memory, and network metrics.
- Performance APIs: Trigger and monitor automated tests via APIs to integrate performance checks into existing workflows.
- Real-World Simulation: Test under varied network conditions, low battery states, and background transitions to mimic real user environments.
- CI/CD Integration: Connect with Jenkins, GitHub Actions, or CircleCI for continuous performance monitoring during app development and deployment.
2. Xcode Instruments
Xcode Instruments is a performance analysis and profiling tool bundled with Xcode. It provides a suite of instruments such as Time Profiler, Allocations, Leaks, Energy Log and Core Animation, each targeting specific performance aspects of an app. This tool allows in-depth inspection of CPU usage, memory allocation, battery consumption and animation smoothness. Instruments are ideal for identifying performance bottlenecks in real-time and offer detailed visualizations for debugging complex performance issues.
3. XCTest
XCTest is Apple’s official testing framework integrated within Xcode. It supports unit, UI and performance testing through functions like measure and XCTMetric. Developers can write performance tests to measure execution time, memory usage, CPU load and more. This tool is best suited for automated testing and can be integrated into Continuous Integration pipelines for ongoing performance monitoring.
4. Firebase Performance Monitoring
Firebase Performance Monitoring is a cloud-based tool that tracks the real-world performance of apps post-deployment. It collects data on app startup time, network latency, slow screens and custom traces defined by developers. The data is displayed in a centralized dashboard, allowing teams to identify trends and spot performance issues across devices, regions and network conditions. It is especially useful for monitoring performance in production environments.
5. Charles Proxy
Charles Proxy is a web debugging tool that allows inspection and manipulation of network traffic between the app and the server. It helps in performance testing by simulating slow or unreliable networks, observing request-response times and analyzing payload sizes. This tool is effective for detecting inefficient API calls, monitoring backend delays and validating content delivery under various network conditions.
Best Practices for Writing iOS Performance Tests
Writing clean, focused and reliable performance tests helps ensure accurate results and long-term maintainability.
Some of the best practices include:
- Target Realistic Scenarios: Focus on performance-critical flows such as screen rendering, data processing, or API handling that reflect actual user interactions.
- Test on Physical Devices: Use real iOS devices instead of simulators to ensure accurate measurements of CPU, memory, and battery usage.
- Use the Right Metrics: Select appropriate XCTMetric types such as XCTClockMetric or XCTMemoryMetric, based on the performance area being tested.
- Isolate the Test Code: Avoid combining multiple operations in a single test. Isolate specific actions to get clear and meaningful performance data.
- Repeat Tests for Accuracy: Run performance tests multiple times to account for system variations and reduce the effect of random fluctuations.
- Define Thresholds for Metrics: Set clear performance benchmarks.
Conclusion
Performance testing is essential to delivering high-quality iOS applications that meet modern user expectations.
With tools like XCTest, Xcode Instruments and BrowserStack App Live, performance issues can be identified early and resolved before reaching end users. Whether it’s measuring screen load times, tracking memory usage or testing under real-world conditions, a well-planned performance testing strategy ensures that the app runs efficiently on every device.
By following the right approach and best practices, iOS teams can build faster, more stable and more reliable mobile experiences.
Useful Resources for iOS
- What is iOS Unit Testing? (Tutorial with Xcode & Swift)
- 20 Best iOS Debugging Tools
- Running Appium Tests on iOS Simulator vs Real Devices
- Android vs iOS Mobile App Testing
- How to run Appium iOS Tests on Real Devices?
- Using Xcode iOS Simulator for Responsive Testing
- Using Xcode iOS Simulator for Responsive Testing
- How to Test React Native Apps on iOS and Android Devices
- iOS Development on Windows: A Complete Guide to Xcode for Windows
- Using Xcode iOS Simulator for Responsive Testing
- What is iOS Unit Testing? (Tutorial with Xcode & Swift)
- How to Use APK File on iOS Device
- What are iOS Mod APKs and how to use them?
- How to check the iOS version?
- Top iOS 16 Features to Test
- How to use Device Logs in Android and iOS to report issues
- A Detailed Guide on iOS App Beta Testing
- Top iOS Devices to Test your App or Website on
- Snapshot Testing in iOS
- What is iOS? A Comprehensive Overview of Apple’s Mobile Operating System
- How to Emulate iOS Environment on Windows
- How to Use APK File on iOS Device
- How to Test Flutter Apps on Real iOS Devices
- How to Test In-App Purchases on iOS Devices
- Does iOS emulator on PC solve testing requirements?

