Selenium with Nightwatch
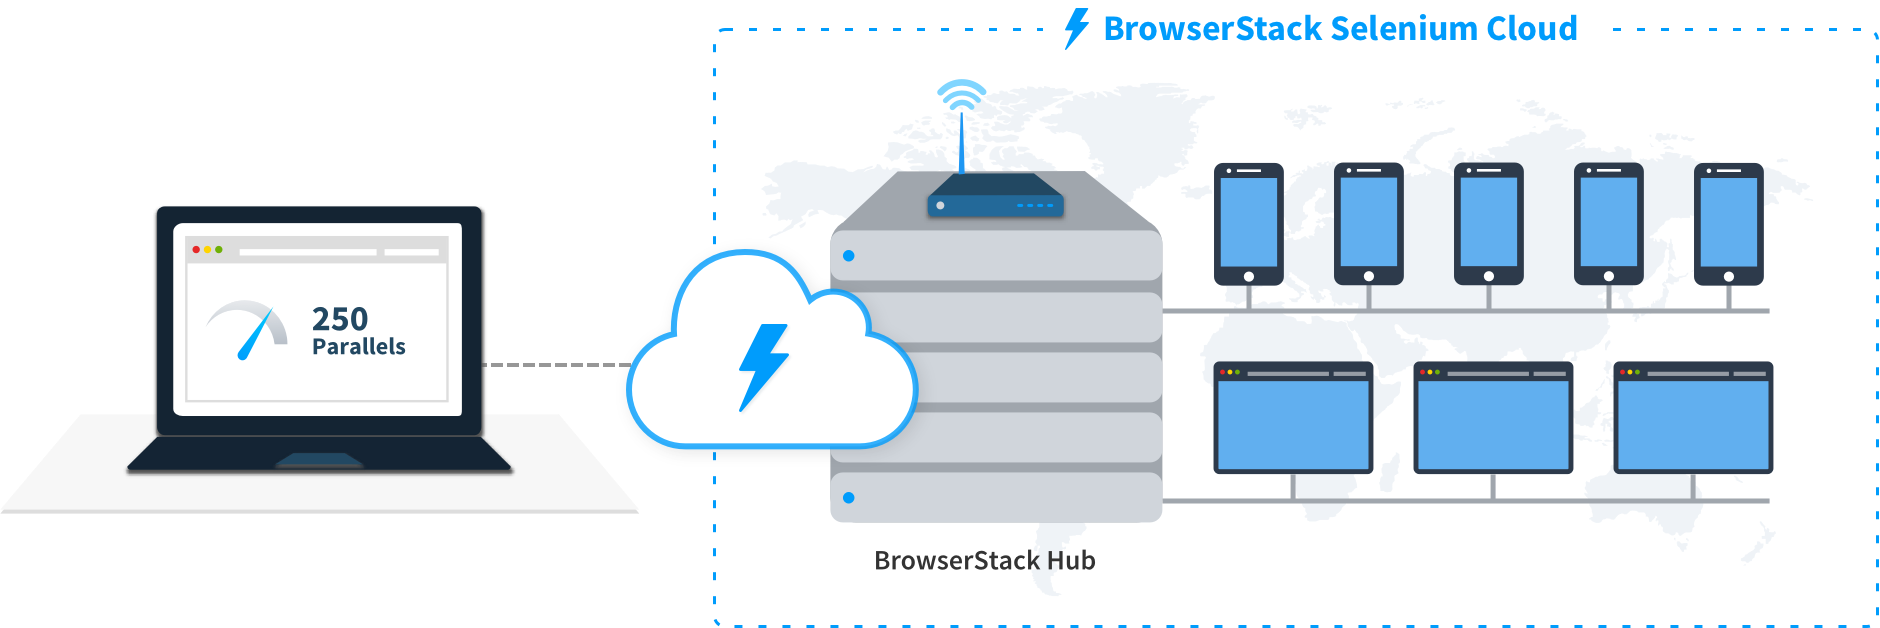
Your guide to running tests using Nightwatch on BrowserStack’s Selenium Grid of 3000+ real devices and desktop browsers.
This section covers running your first build with BrowserStack’s sample repo. To run builds with your existing test suite(s), skip to integrate your test suite.
Prerequisites
- BrowserStack Username and Access key. You can find this in your account profile. If you do not have an account yet, you can sign up for a Free Trial.
- Node.js v12 or higher installed on your machine.
- Nightwatch 2.6.0 or higher installed on your machine.
Run sample build
Run a sample Nightwatch test build using the following steps on BrowserStack:
Get Sample Project
Get our sample project using one of the following options:
Option 1: Download Project
Option 2: Using Git
Clone the sample repository and install the dependencies using the following commands:
Configure the test script
To run a test, you need to configure the following parameters in the sample repository.
Set access credentials
Set the userName and accessKey variables to your BrowserStack credentials in the nightwatch.conf.js file. This is to authenticate your tests with BrowserStack.
Configure browser or device combinations
Choose from 3000+ real mobile devices and browsers available on BrowserStack:
Copy and replace the environments.js config file
Copy the following configuration and add it to the nightwatch-browserstack/environments.js file of the sample repository.
Execute the build on BrowserStack
You are now ready to run your build on BrowserStack. From the root directory of this project, run the following command.
Facing issues? View commonly occurring errors
Check the regular culprits
Check if the file is saved correctly and you’ve installed the required packages and libraries installed to run the test. In most cases, searching on Google is helpful.
Authentication errors
If you’re encountering authentication errors, it’s possible that you haven’t passed the correct credentials, or that the credentials you passed are incorrect. You can find your Username and Access Key in the Account profile page. Try running the test again and it should solve your issue!
Behind a proxy?
You might face some connection issues if you are behind a proxy as your network may be blocking traffic to browserstack.com. Allowlist the traffic to *.browserstack.com and you’re all set. If you have a complex network setup, reach out to our Support team and we’ll assist you to get this working.
After you run your test, visit the Automate dashboard to view your test results.
Next steps
After you have successfully run your first test on BrowserStack, try integrating your test suite with BrowserStack
We're sorry to hear that. Please share your feedback so we can do better
Contact our Support team for immediate help while we work on improving our docs.
We're continuously improving our docs. We'd love to know what you liked
We're sorry to hear that. Please share your feedback so we can do better
Contact our Support team for immediate help while we work on improving our docs.
We're continuously improving our docs. We'd love to know what you liked
Thank you for your valuable feedback!